Understanding business processes can feel overwhelming. But not with the right tools. In this guide, I’ll walk you through the BPMN core elements with Camunda—one of the most powerful platforms to model and automate business processes. You’ll see how each element works and why it matters. Let’s get started!
What Is Camunda?
Camunda (opens in a new tab) is an open-source platform. It helps me design, automate, and monitor business processes using visual models. I use it to bring clarity to workflows. Whenever a process seems too complex, I model it in Camunda. As a result, I get transparency, structure, and logic.
Moreover, Camunda supports the BPMN 2.0 standard. That’s why I can ensure my models are consistent and professional. Since Camunda offers a simple drag-and-drop interface, it’s easy for both developers and business analysts to use. And that’s one of the reasons I love it.
What Is BPMN 2.0?
BPMN 2.0 stands for Business Process Model and Notation. It’s a standardized graphical language. I use it to represent business processes visually. That way, everyone can understand what’s going on—whether they’re technical or not.
The beauty of BPMN 2.0 lies in its simplicity. It uses a few key symbols to map out what needs to happen, when it happens, and under what conditions. Because it’s widely adopted, BPMN 2.0 works as a common language for teams. And yes—it works perfectly with Camunda.
BPMN Core Elements with Camunda
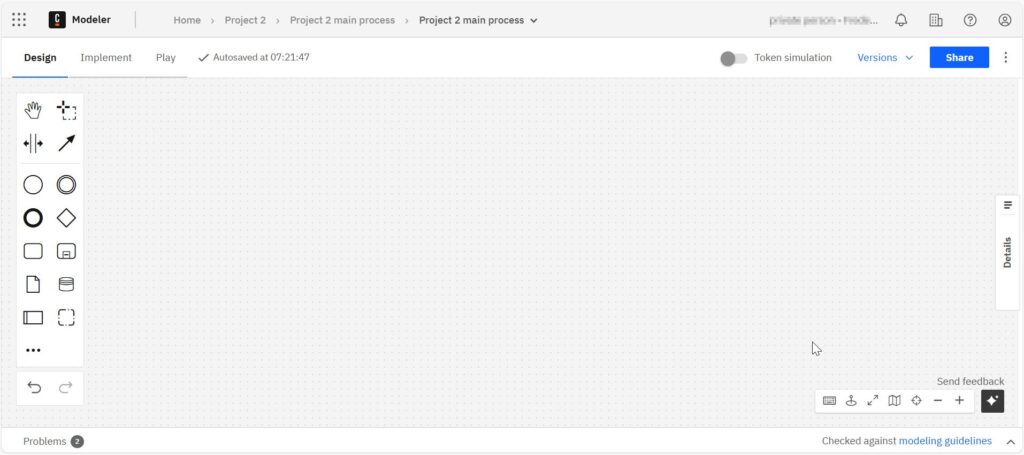
Let’s dive into the heart of this article. When I model a process in Camunda, I use the BPMN core elements. These include flow objects, connecting objects, artifacts, and participants. Each plays a specific role. I start with an empty editor.
Flow Objects
These are the main building blocks of any BPMN diagram. I work with three types:
Events
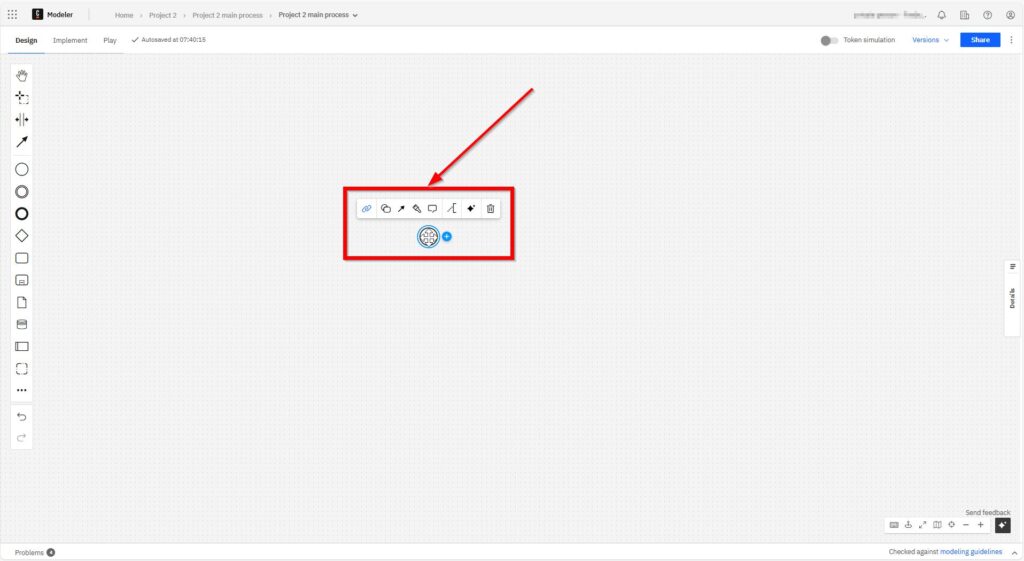
Events signal when something starts, happens, or ends. To add a Start Event, I click the circle icon on the left in Camunda. I use it to trigger a new process. For example, a customer submits a form. That’s my trigger.
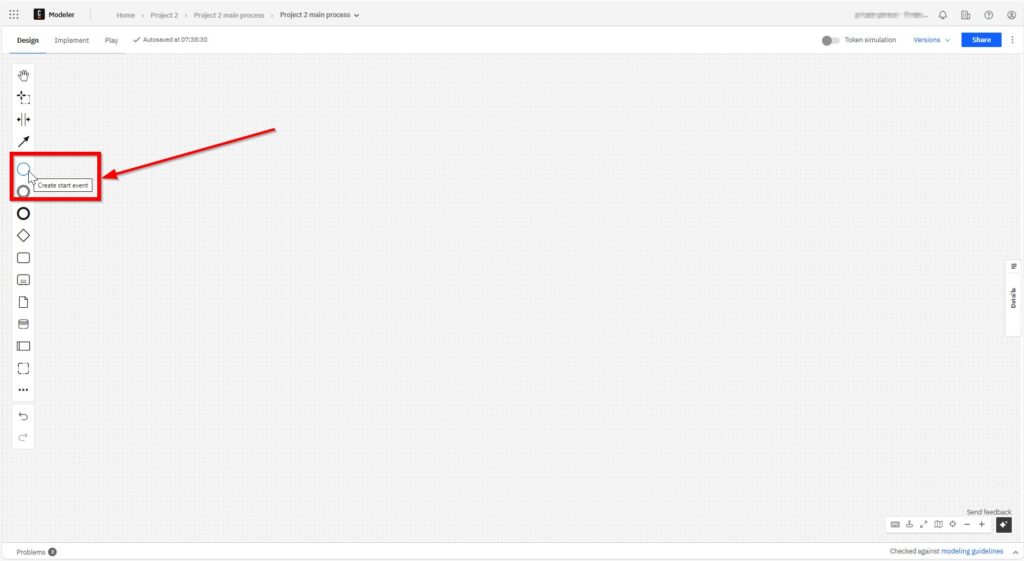
The start element is now docked to the cursor.
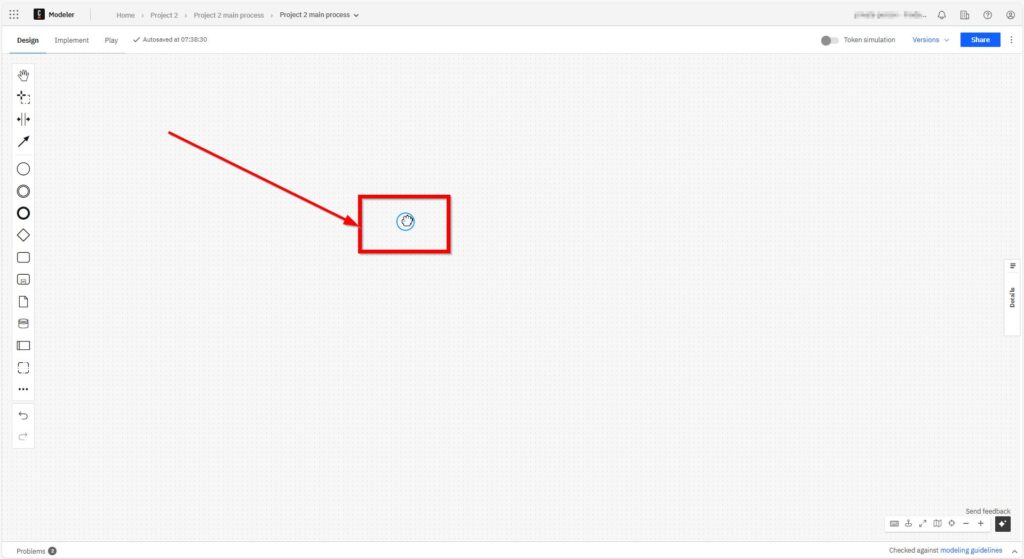
With another left click I place the start element in the grid.
I also use Intermediate Events when something needs to happen in between.
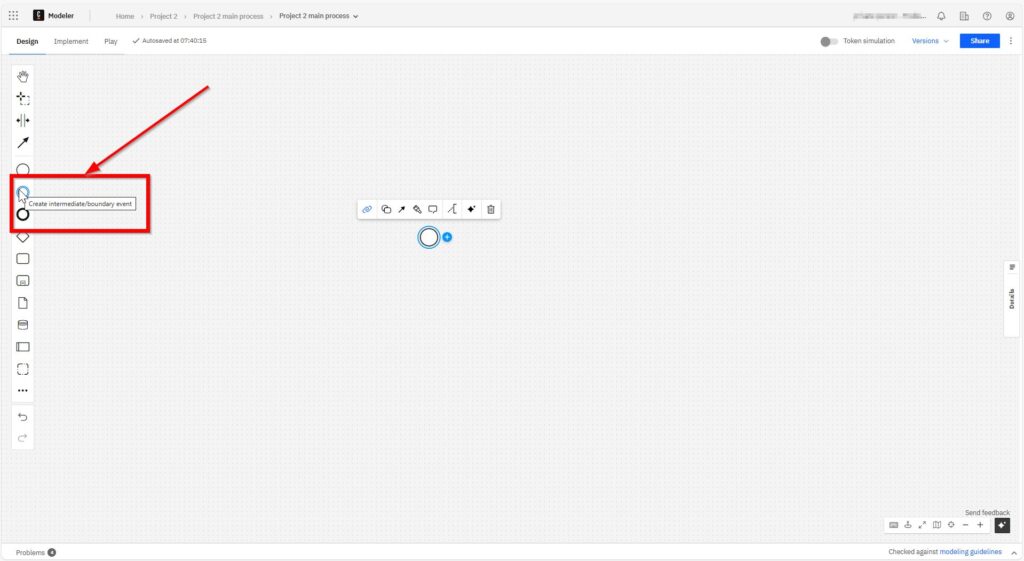
And I always end with an End Event to close the process properly. That helps everyone know where the workflow finishes.

Tasks
Tasks represent activities. I use them to show what needs to be done. Each task is a single unit of work. I simply drag it into the diagram.

Again, I dock the element to the cursor.
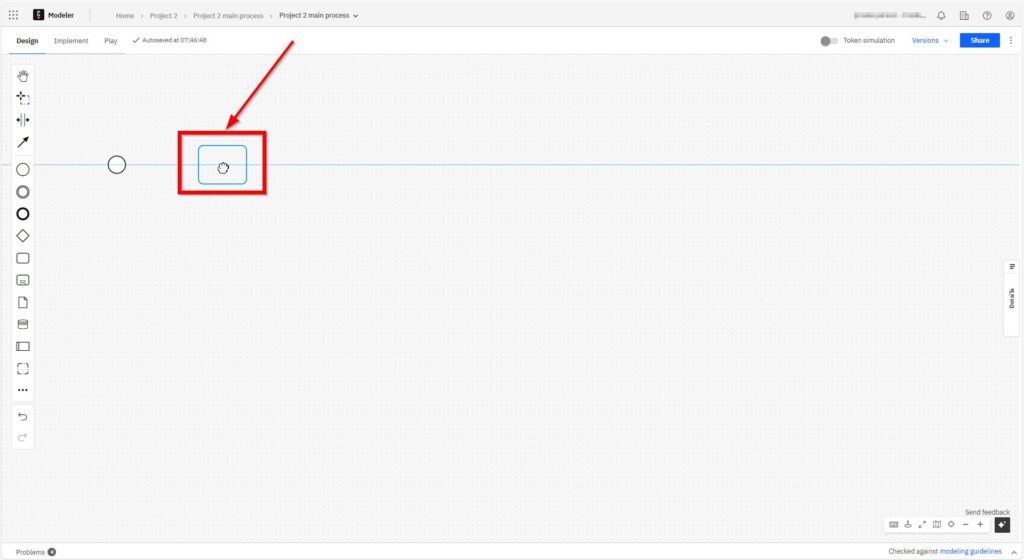
With another left click, I place the task element in the grid.

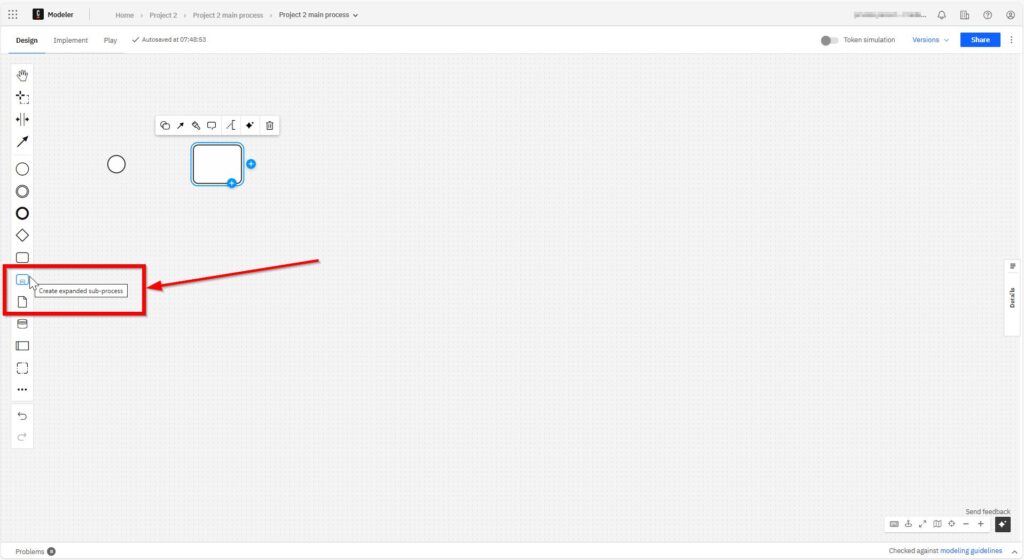
Sometimes, I use a Sub-Process when a task becomes too complex. That lets me keep things clean and organized.
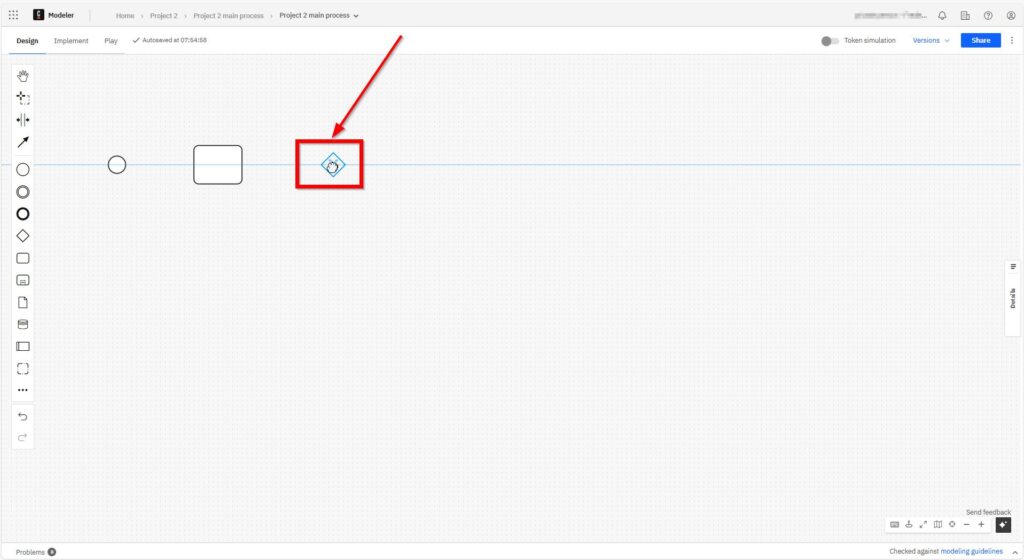
Gateways
Gateways add conditions. They allow the process to flow in different directions based on decisions. I use them when a process depends on a yes/no condition. For example, if an application is approved, the flow goes one way. If not, it goes another. This adds logic to the process.
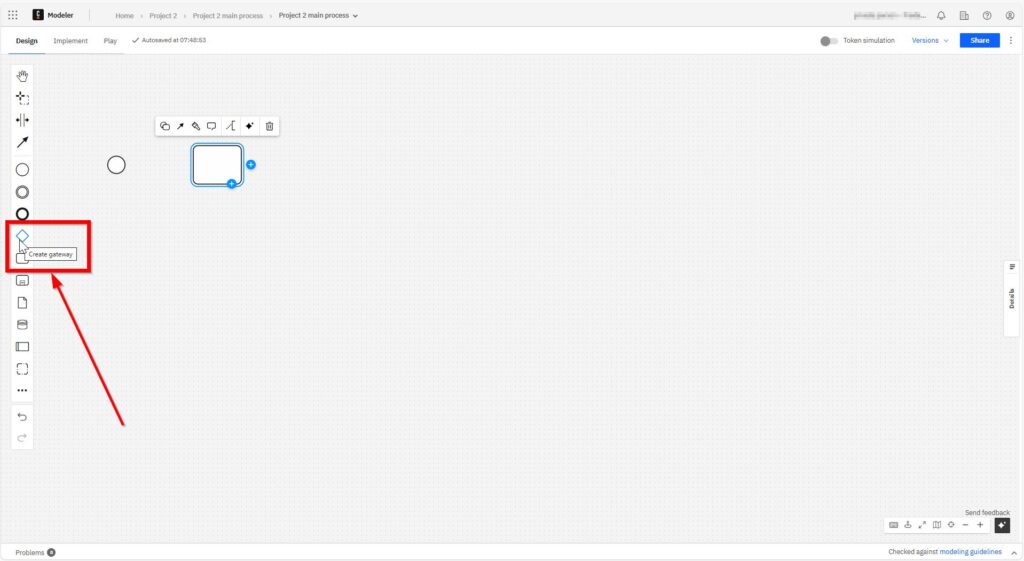
Again, I dock the corresponding element to the cursor.
BPMN Artifacts
A BPMN artifact gives additional context. They don’t change the flow, but they help explain it.
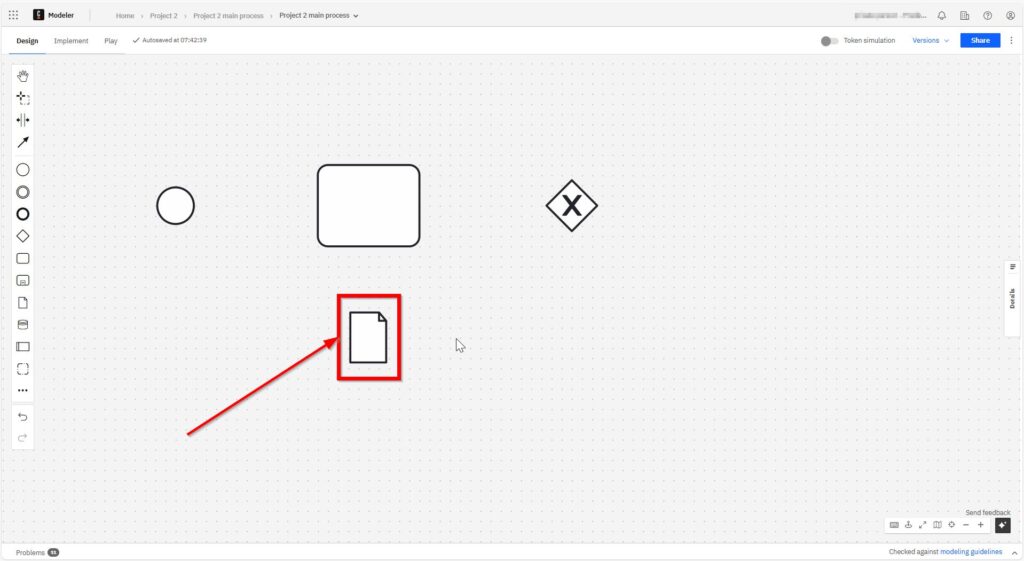
Data Objects
I attach a BPMN data object to show what kind of data is involved. For example, an invoice or a report. These are vital for documentation.
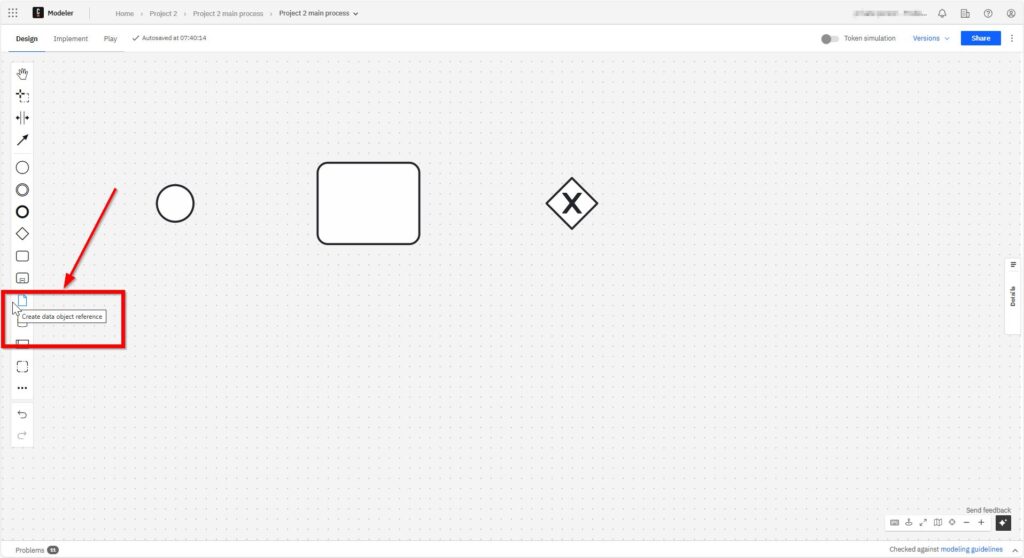
Again, I dock the corresponding data object to the cursor.
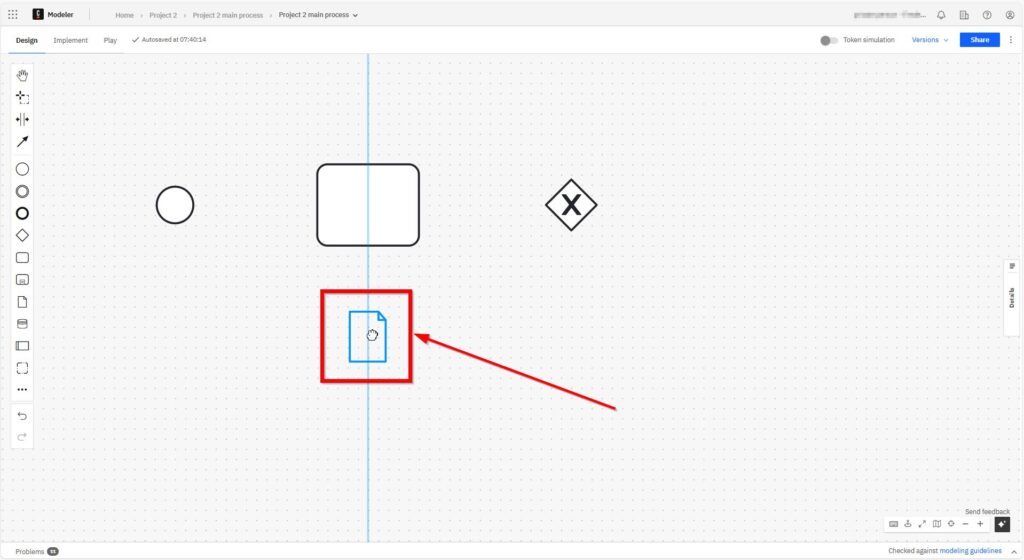
With another left click, I place the data object element in the grid.
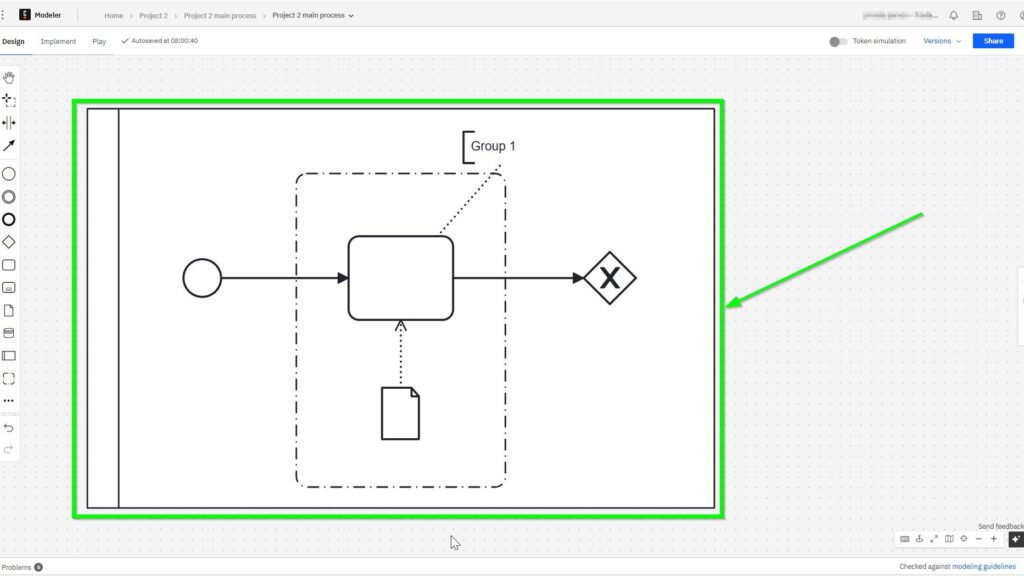
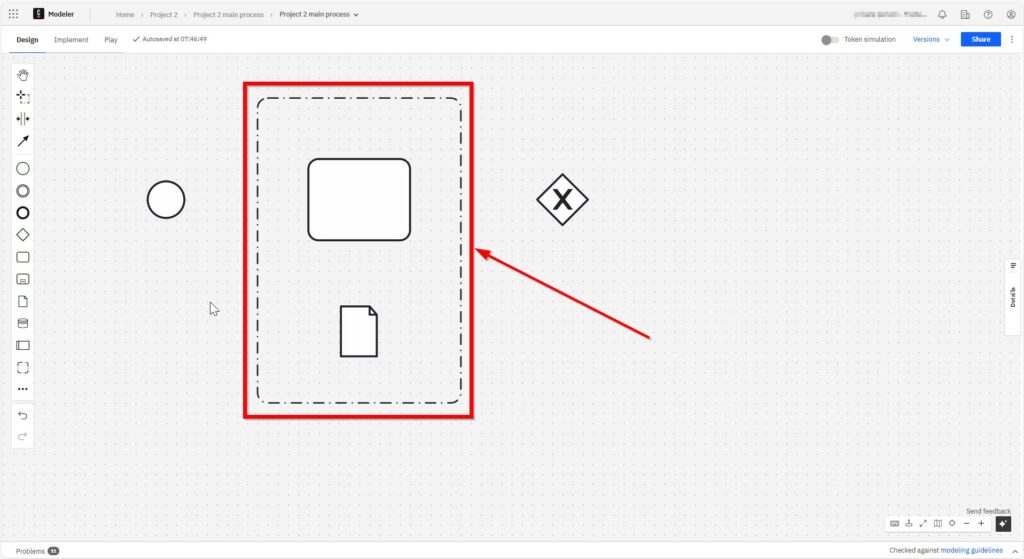
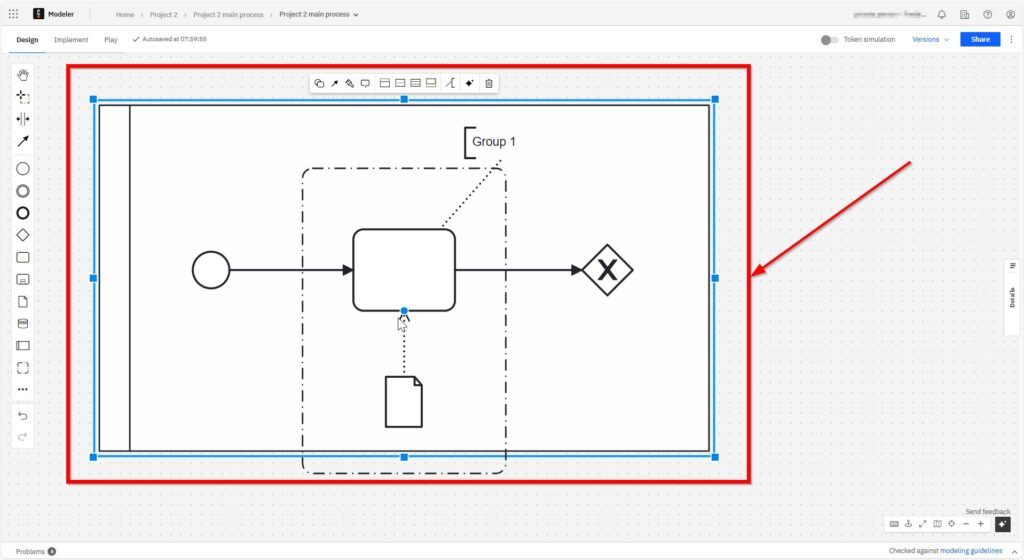
Groups
I use groups to cluster related tasks. They don’t affect the flow but help me organize complex processes.

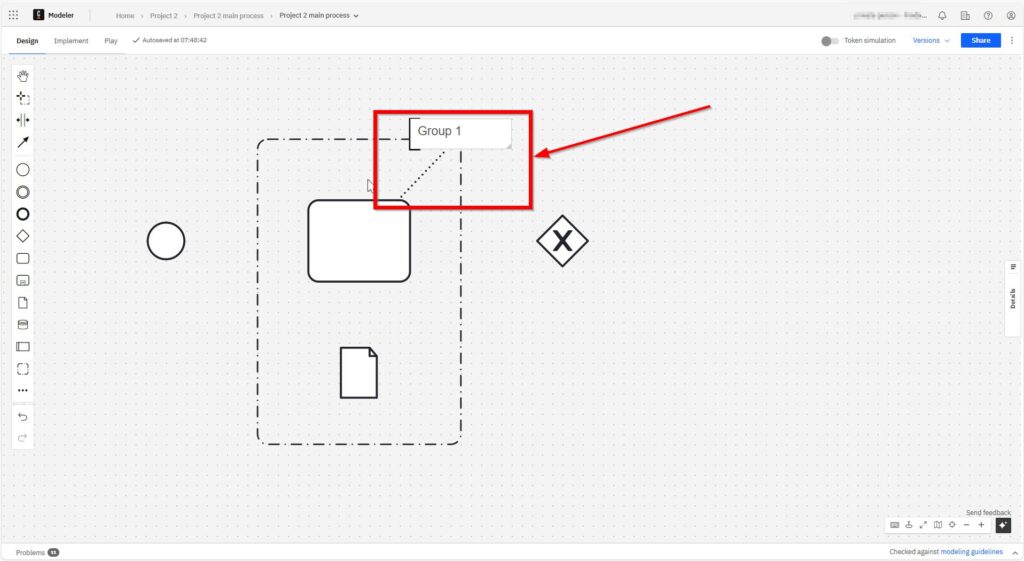
I move the grouping element to the cursor.
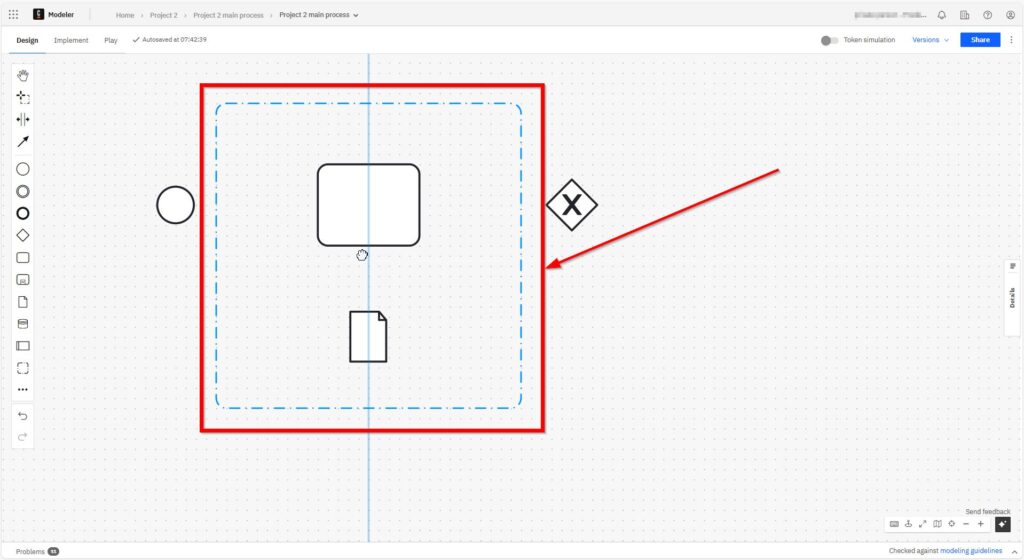
With a left click, I place the grouping element in the grid.
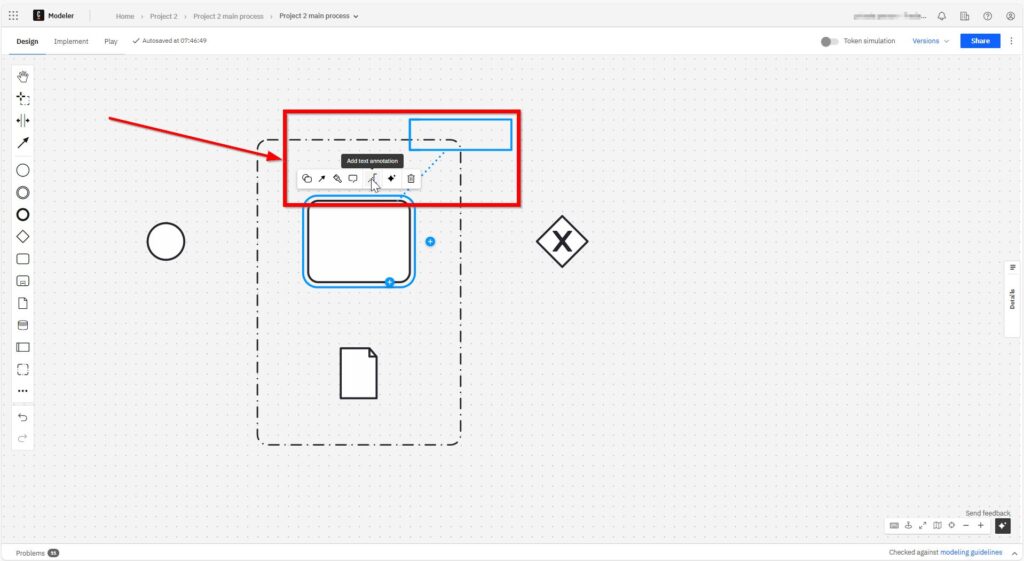
Text Annotations
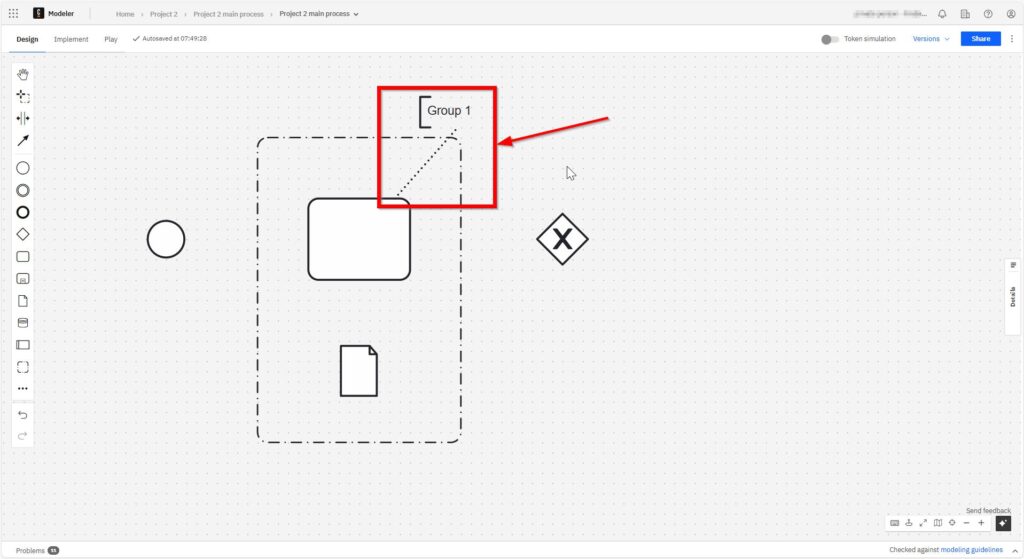
Sometimes, I need to explain something. I click “Add text annotation” and write directly into the diagram. This is useful for notes, assumptions, or extra details.
I note the label “Group 1”.
I note the label “Group 1”.
Connecting Objects
These elements connect everything.
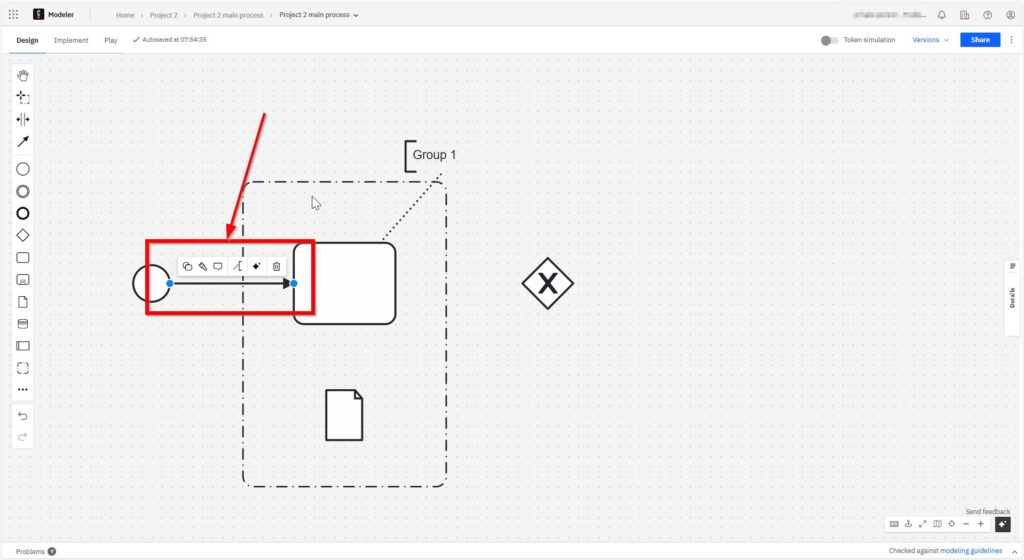
Sequence Flows
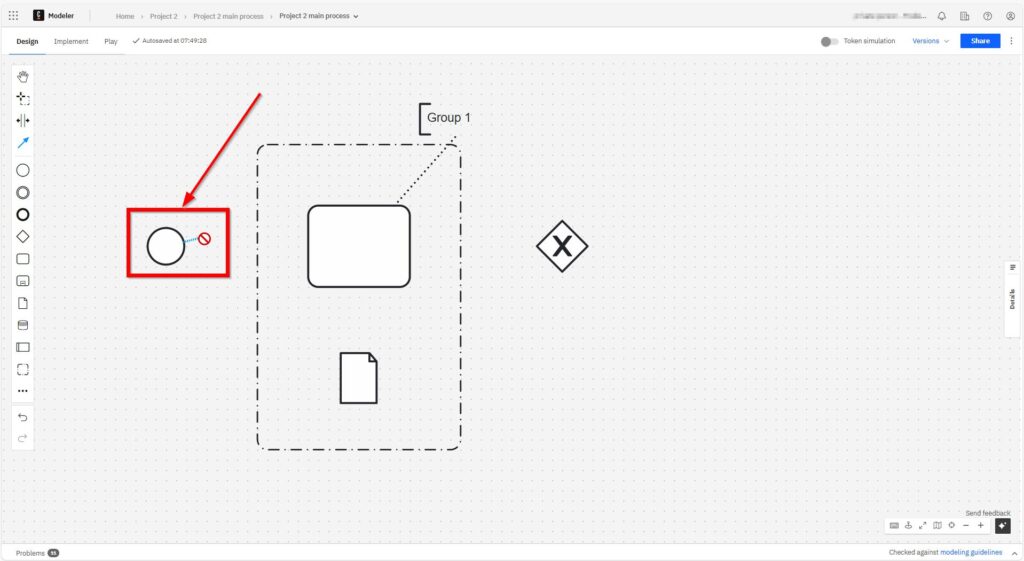
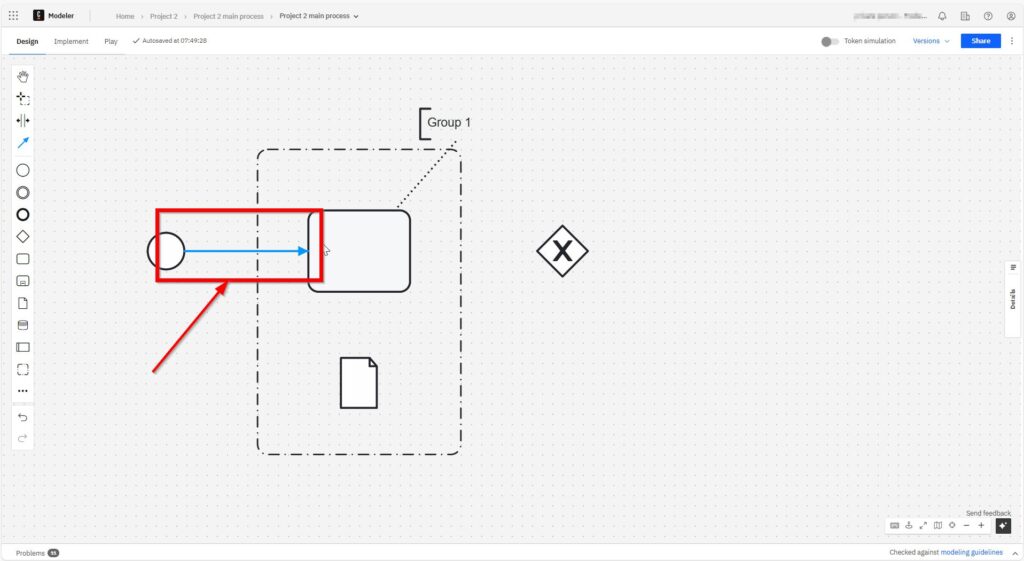
I use sequence flows to show the order of activities. Each arrow leads from one element to the next. It’s the glue that holds everything together. Without sequence flows, the diagram would make no sense. I click on the start element and can now loosely select the element to be connected.
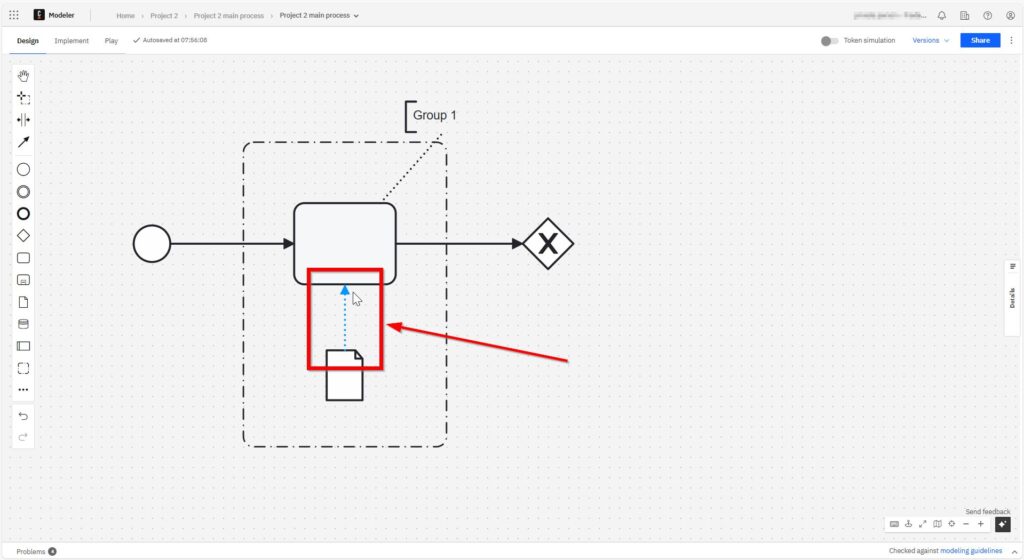
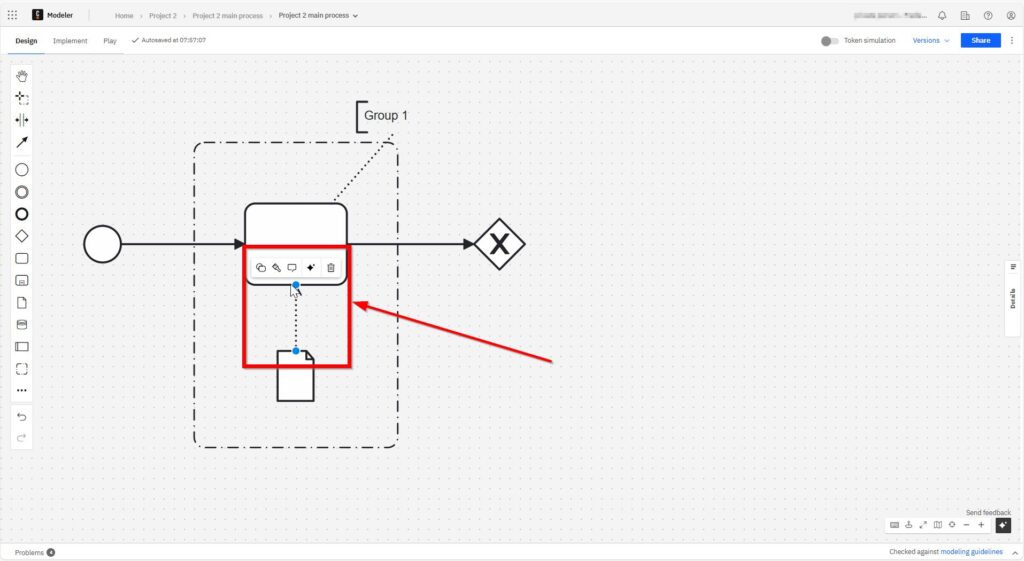
Data Associations
A data association links data objects to tasks. I use them to clarify what information is used or produced during a task. This adds an extra layer of meaning to my diagram.
As with the sequence flow, I click on the object I want to start from – here the data object.
Participants
Processes don’t happen in isolation. People, teams, or systems are involved. I use Pools and Lanes to show this. A Pool represents a participant, like a company or department. Lanes divide that pool into roles or teams.
As with the sequence flow, I click on the object I want to start from – here the data object.

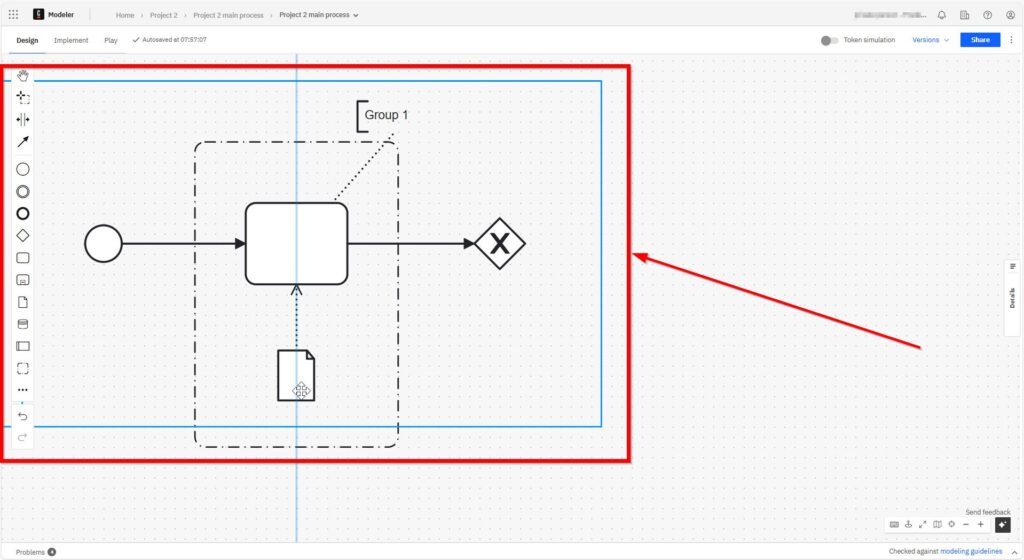

This structure makes it clear who does what. And it helps when modeling interactions between an actor and up to multiple actors.
Final Thoughts
Modeling BPMN core elements with Camunda has changed how I approach process design. With just a few symbols, I can make sense of even the most chaotic workflows. Because Camunda follows the BPMN 2.0 standard, everything I model is scalable and professional.
I now see tasks, events, and gateways not as abstract shapes but as essential tools. With sequence flows and data objects, my diagrams speak a universal language. And with pools and lanes, I include everyone involved.
If you’re new to BPMN or Camunda, don’t worry. Start simple. Explore each core element one by one. Soon, you’ll master the art of process modeling—and you’ll enjoy every step of the way.
Whether you’re designing new workflows or improving old ones, BPMN core elements with Camunda will guide you. Every time.
| Read more on Business Process Modeling and Notation (BPMN) |
|---|
| Syntax and Semantics of BPMN BPMN Project Roles for Effective BPM The Participant Perspective in BPMN BPMN Core Elements |