I often get asked, “What is a Context Diagram?” As a tech enthusiast, I love explaining it. A context diagram defines a system’s scope and shows what lies inside or outside its boundaries. It clarifies how the system interacts with an external entity. While classic Structured Analysis diagrams are rare today, modern tools like UML use case or component diagrams can serve the same role, even simple tables if they include the essential elements.
What is Requirements Modeling
What is Requirements Modeling? In requirements engineering, IT business analysis, and project management, requirements modeling is the structured approach to defining what a system must achieve. It translates stakeholder needs into clear, analyzable, and testable models. These models visualize system functions, data, and interactions, ensuring everyone shares the same understanding. By using diagrams and structured descriptions, requirements modeling reduces ambiguity, supports decision-making, and lays the foundation for successful system design and implementation.
Basic Elements of Context Diagrams
Above all there are three essential elements in a context diagram:
- The system under development: This defines the system boundary.
- A neighboring system or actor: These are all people, roles, IT systems, and equipment interacting with the system.
- The interfaces: These represent the logical connections between the system and its neighboring systems.
The Role of Interfaces
Interfaces are crucial. They are best determined by examining the incoming and outgoing data. A classic context diagram focuses on this data flow. To point out, it’s a high-level data flow diagram (DFD). With this in mind the goal is to identify all interfaces of the system.
Notation Elements for Context Diagrams
Data flow diagrams are excellent for modeling context diagrams. In these diagrams, the system under development is often depicted as a circle, box, or cloud. Overall this represents the system boundary.
Neighboring systems can be shown in various forms. Boxes, stick figures, 3D boxes, or double lines for external databases are common. These neighboring systems, or terminators, are any endpoints of communication with the system. In detail they could be people, hardware, software, sensors, or even data storage.
Data flows are depicted as straight or curved lines with arrowheads. Arrows pointing to the system indicate input. Arrows pointing away indicate output. Double arrows represent bidirectional data flow. These flows show the incoming and outgoing data or control information. If the arrows also represent control flows, a legend should explain this.
Tipps for Context Modeling
When creating context diagrams, consider these rules:
- Include all interacting neighboring systems, i.e. ensure completeness of communication partners.
- Name all neighboring systems, i.e. this clarifies the source and destination of data.
- Label all inputs and outputs, i.e. unnamed arrows indicate a lack of understanding.
Visualizing Context Diagrams
Graphical illustrations can make context diagrams clearer. Hence, use simple shapes like circles or boxes for the system and neighboring systems. Arrows can show data flows. Here’s a basic graphical example to illustrate. A box with rounded corners represents the system:
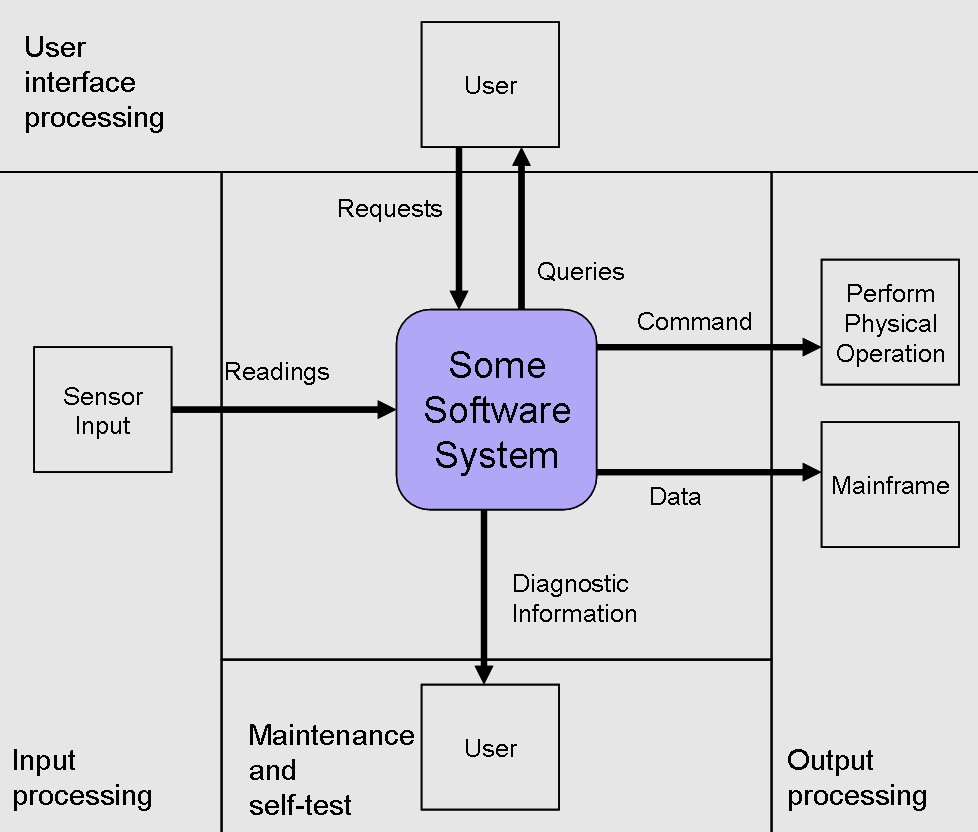
To emphasize, the system is a box with a rectangle in the center. Neighboring systems are smaller boxes around it. Arrows show the direction of data flow. Labels indicate the type of data.
Conclusion
So, what is a context diagram? It’s a powerful tool to define and visualize the scope of a system. Therefore, by focusing on interfaces and data flows, it helps us understand how the system interacts with its environment. Remember to use graphical elements and follow pragmatic rules for clarity. In this case, you can create effective context diagrams that enhance system comprehension.
What’s Next?!
Now that you understand what requirements modeling is and why it matters, it’s time to explore how we can make it even more powerful. In my next article, “Enhancing Requirements Modeling: Adapting UML and SysML with Stereotypes,” I’ll show how subroutines organize and reuse code efficiently. Join me to learn how they make programs cleaner, faster, and easier to maintain across a different programming language.
Continue Your Journey with Requirements Modeling
If I want to understand requirements in a clearer and more practical way, I need more than text alone. I need models that show how ideas, processes, and structures fit together. In the main article on Requirements Modeling, I explore essential Modeling Concepts, Process Modeling with BPMN, and UML to make complex systems easier to analyze and discuss. As a result, I can communicate requirements more effectively, see relationships more clearly, and build a stronger foundation for successful system design.
Credits: Context Diagram Example by Chrislk02 from Wikimedia Commons under the GNU Free Documentation License
This article covers concepts that are also included in the CPRE certification syllabus.