
Complex diagrams in draw.io can quickly become overwhelming. Therefore, I use tags to stay organized. In this guide, I explain how to use the tags view in draw.io. You’ll learn how tags help you label elements, show or hide diagram parts, and manage larger diagrams with more control.
What Is the Tags View in draw.io?
The Tags View gives me a simple way to classify elements in a diagram. I can assign a tag to shapes and connectors that share a specific meaning. Then, I can manage these elements through the Tags panel.
For example, I may have a network diagram that contains internal systems, external systems, optional components, and web-facing components. I can assign a tag such as web_relevant to the elements that belong to one of these categories.
Tags give me a logical way to organize related diagram elements without changing their position on the canvas.
Therefore, tags work well when the visual position of an element does not fully describe its purpose. I can keep the original diagram structure while adding another level of organization.
I also use tags when I want to control visibility. Instead of deleting elements or creating another version of the diagram, I can temporarily hide tagged content. Later, I can show it again.
How to Open the Tags View in draw.io
First, I open the Tags View. I click View in the main menu and then select Tags.
On Windows, I can also press Ctrl+K. This shortcut opens the same panel and saves time when I use tags frequently.
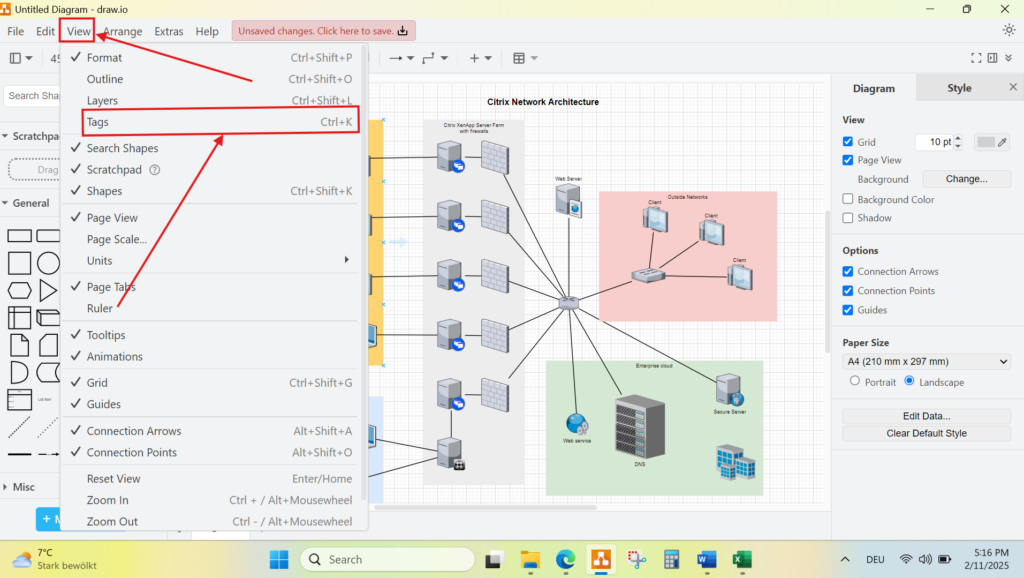
After I activate the option, draw.io opens the Tags panel above the diagram. If the diagram does not contain any tags yet, the list is empty.
The panel contains the controls that I need to create tags and manage tagged elements. Therefore, I can leave it open while I continue working on the diagram.

How to Add a Tag to Diagram Elements
Next, I decide which elements should receive the same tag. A tag becomes useful when it represents a clear characteristic or category.
In my example, I want to identify content that is relevant to the web. Therefore, I select the appropriate element in the network diagram. I can also include a connector if it belongs to the same logical category.
After I make the selection, I click the plus symbol at the bottom of the Tags panel.
I select the relevant diagram elements before I create and assign the new tag.
This sequence matters because draw.io needs to know which elements I want to associate with the tag.

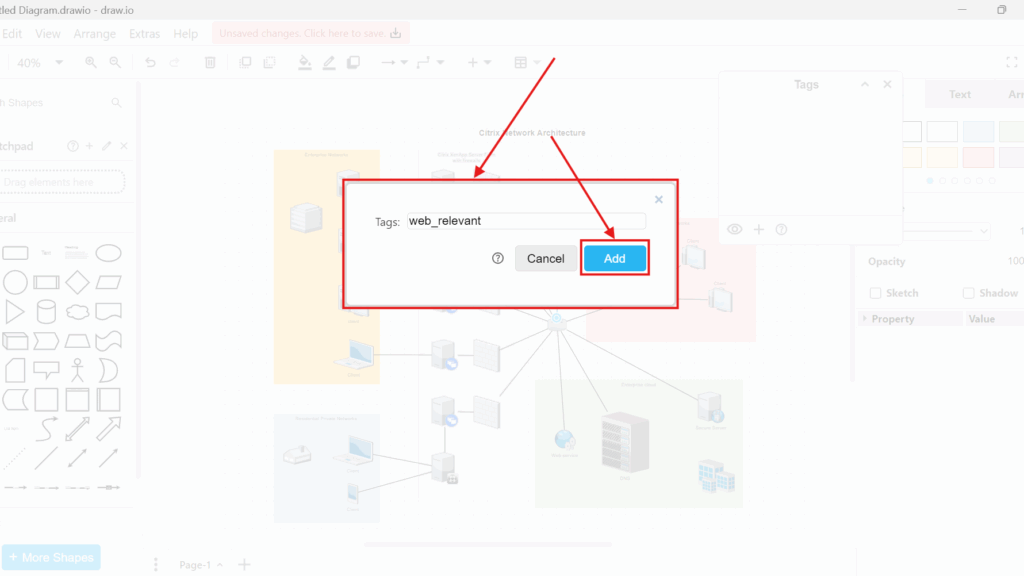
A dialog now asks me for the tag name. I enter web_relevant and select Add.
I prefer short and descriptive tag names. The name should tell me immediately why I created the category. This becomes increasingly important when a diagram contains several tags.
For example, I could use names that describe a system type, responsibility, status, environment, or audience. However, I avoid vague names that require additional explanation.

How to Check an Assigned Tag
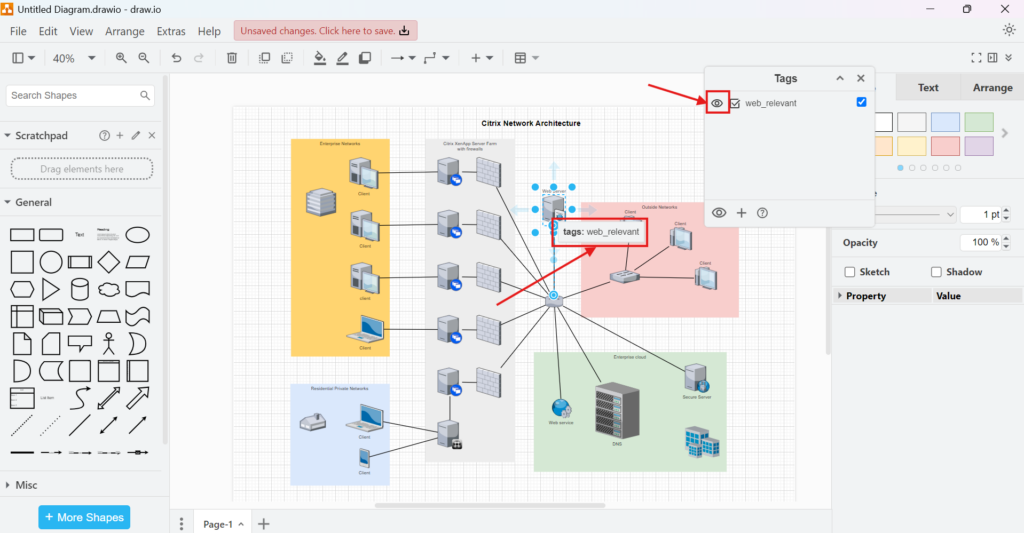
After I add the tag, it appears in the Tags panel. I can now use this entry to manage the associated elements.
I also check whether I assigned the tag correctly. When I work with the tagged element, draw.io can show the associated tag information. In my example, the element displays the value web_relevant.
I verify the assignment before I continue because an incorrect tag can later hide or select the wrong parts of the diagram.
This check becomes particularly useful in a large diagram. A small mistake may otherwise remain unnoticed until I start using tags to control the view.
How to Show and Hide Tagged Elements
One of the most useful functions of the Tags View is visibility control. The eye icon beside a tag determines whether I can see the elements associated with that tag.
Initially, the eye is active. Therefore, the tagged web server remains visible in my diagram.
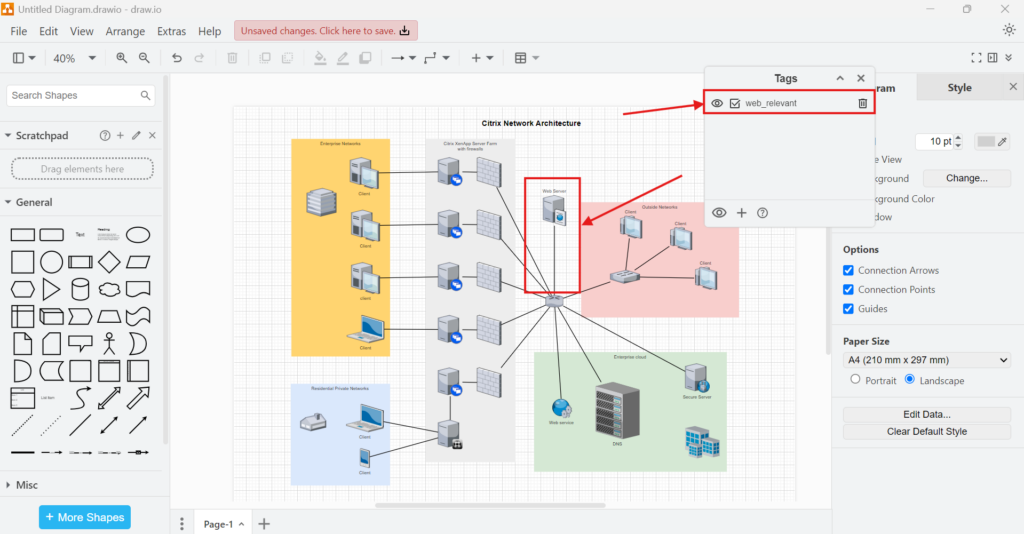
When I click the eye icon, I hide the tagged content. The web server therefore disappears from the current diagram view.
However, I have not deleted the element. It remains part of the diagram and keeps its tag. I can use the visibility control again when I want to display it.
The eye icon changes the current visibility of tagged content; it does not delete the underlying diagram elements.
This distinction is important. I can simplify a complicated diagram temporarily without changing its actual content.

Why I Use Tags in Large Diagrams
Tags become more valuable as a diagram grows. In a small diagram, I can often understand every element immediately. In a large architecture, process, or system diagram, however, several logical perspectives may overlap.
For example, I may want to distinguish customer-facing systems from internal systems. In another case, I may want to identify elements that belong to a particular release, responsibility, environment, or technical function.
Instead of producing separate copies of the diagram, I can maintain one model and use tags to control what I currently need to see.
I use tags when several meaningful views need to coexist inside the same diagram.
As a result, I can reduce visual complexity while preserving the complete model. This is especially helpful during reviews and presentations. I can focus attention on a relevant subset and then restore the complete view when necessary.
Tags and Layers Serve Different Purposes
I do not treat tags as a replacement for layers. Instead, I use both concepts for different forms of organization.
Layers help me structure larger visual sections of a diagram. Tags give me another way to relate individual elements according to their meaning.
For example, two shapes may appear in completely different areas of a network architecture. I may still assign both of them the same tag because they share a security classification or technical function.
Therefore, I choose the mechanism according to the relationship I want to represent. If the organization is mainly structural, I consider layers. If I need a logical classification that can span different areas of the diagram, I consider tags.
How I Choose Useful Tag Names
A tag only helps me if I can understand its meaning later. Therefore, I use consistent names.
I prefer specific names such as web_relevant, external_system, internal_service, optional_component, or review_required over generic names such as group1 or important.
However, I also avoid creating a separate tag for every minor characteristic. Too many categories make the Tags panel harder to manage.
A good tag represents a meaningful classification that I expect to use again.
Before creating a tag, I therefore ask what I want to do with the resulting group. If I intend to identify, select, show, or hide those elements together, the tag usually has a clear purpose.
When the Tags View Is Most Useful
I use the Tags View when the same diagram must support several perspectives. This often happens in network architectures, system landscapes, process models, technical documentation, and training diagrams.
For example, I can tag only the components relevant to a specific audience. I can then hide technical details during a management presentation. Afterwards, I can restore those elements for a technical review.
Likewise, I can tag optional components or elements that belong to a particular scenario. Therefore, I do not need to modify the basic diagram every time I change the focus.
Tags let me reduce what I see without reducing what the diagram contains.
That is the main reason I find them useful. They add a simple control mechanism to a diagram while leaving its underlying structure intact.
Conclusion
The Tags View in draw.io gives me a practical way to classify and control related shapes and connectors. I first open the panel through View > Tags. Then, I select the relevant elements, create a descriptive tag, and verify the assignment. Finally, I use the eye icon to show or hide the tagged content.
This approach becomes especially valuable in larger diagrams. I can maintain one complete model while changing the visible perspective according to my current task. Therefore, I use tags whenever I need logical organization and flexible visibility without creating separate versions of the same diagram.
What’s Next?
Now that I know how to use the tags view in draw.io, I can organize diagram elements more clearly. However, some diagrams also need hidden information behind the visible shapes. That is where metadata becomes useful. In the next article, I’ll explain Manage Metadata in Draw.io: A Simple Guide. You’ll learn how metadata adds extra context, supports better documentation, and helps you manage diagrams with more precision. Click below to continue and improve your draw.io diagrams with metadata.
Build a Stronger Requirements Engineering Toolchain
Requirements engineering becomes more reliable when I use tools that support clear structure and collaboration. Therefore, I use draw.io to visualize ideas, Confluence to document knowledge, Jira to manage requirements-related work, and Camunda to model business processes. Each tool helps me handle complexity in a practical way. As a result, I can connect diagrams, decisions, tasks, and workflows more clearly. In the main article on Requirements Engineering Tools, I show how these tools work together and support a stronger requirements engineering process.
| Read mora about draw.io |
|---|
| Import PNG Export JPEG Export WebP Export SVG Export |