
Complex processes can feel overwhelming. That is why I use flowcharts to turn confusion into clear steps. In this guide, I show a simple example of making a flowchart with draw.io. You’ll learn how the basic workflow works and how it helps you explain logic, solve problems, and understand processes faster.
What a Flowchart Shows
A flowchart represents a process as a sequence of symbols and connections. Each symbol has a purpose. For example, I can distinguish an activity from a decision immediately. Arrows or connectors then show how the process moves from one element to the next.
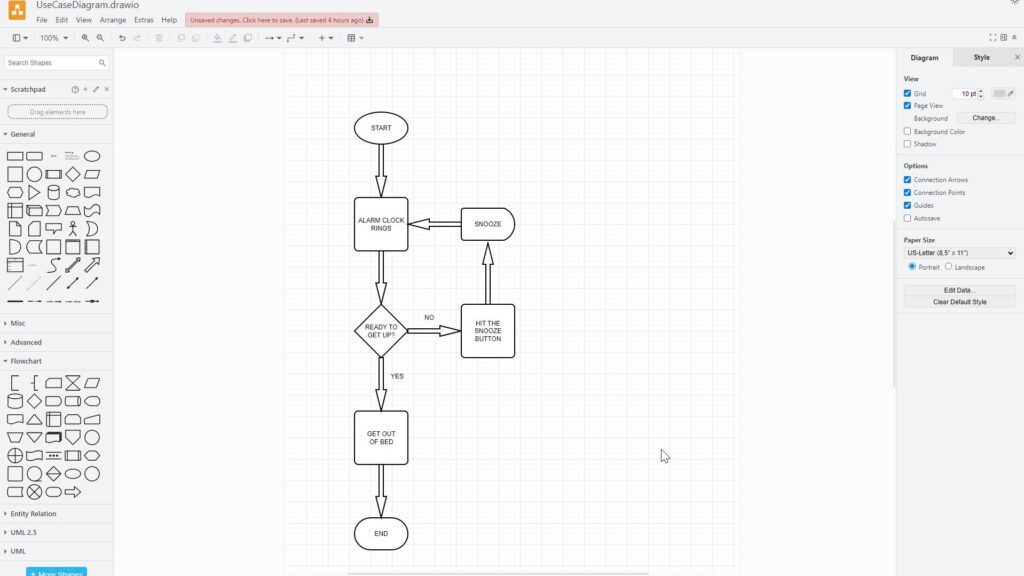
In this example, I model a familiar situation. An alarm clock rings. I decide whether I am ready to get up. If I am ready, I get out of bed. Otherwise, I press the snooze button and return to the earlier step.
A good flowchart makes actions, decisions, paths, and loops visible without requiring a long explanation.
1. Open the Flowchart Shape Library
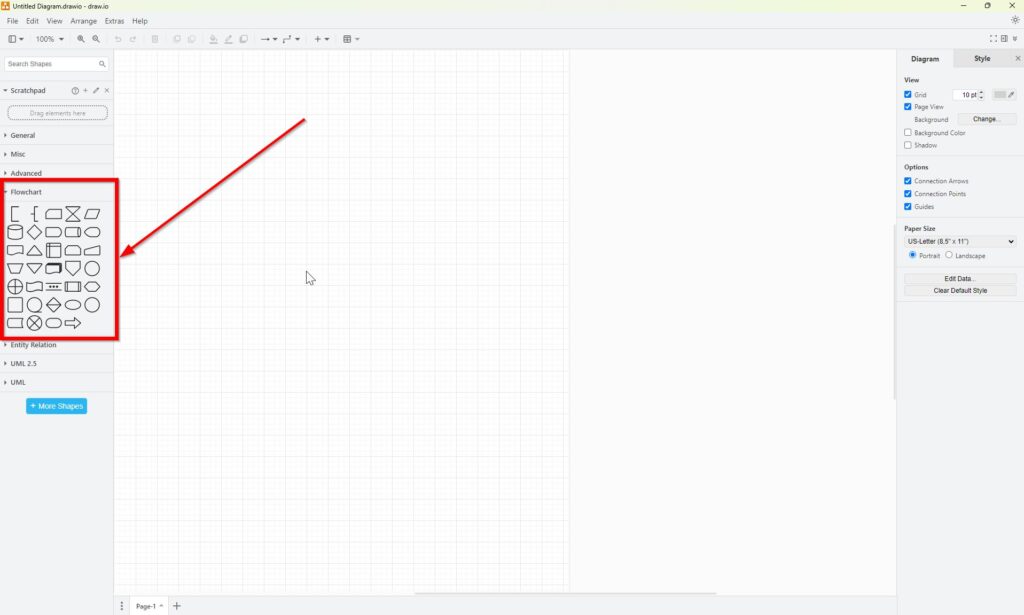
First, I open the Flowchart library in the left sidebar of draw.io. It contains common symbols for processes, decisions, delays, start and end points, and other flowchart concepts.
For a small diagram, I need only a few of these shapes. Therefore, I avoid adding symbols that do not contribute to the process logic.
2. Define the Start of the Process
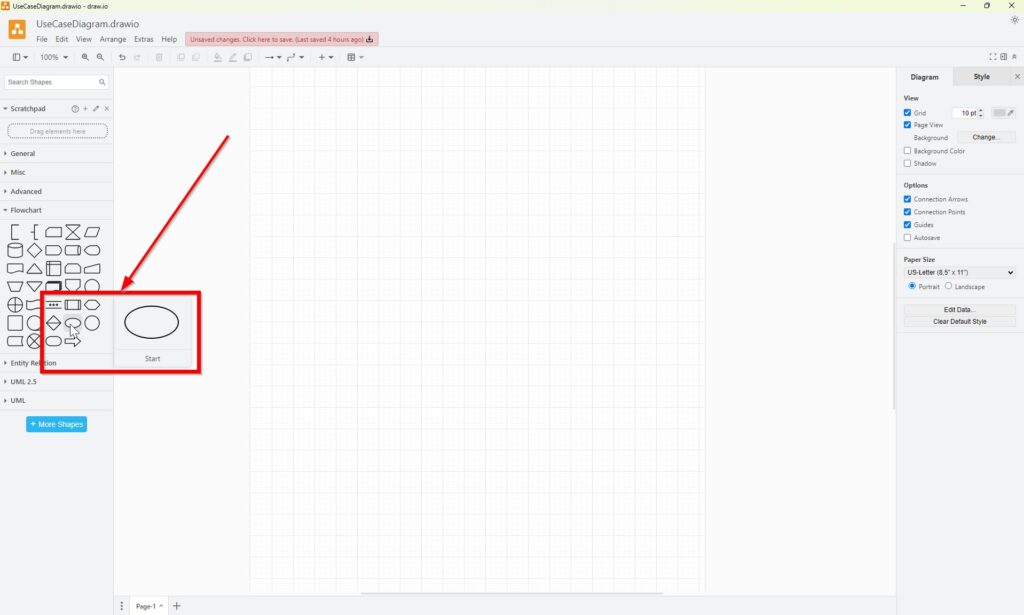
Next, I add a start point. I drag the Start symbol onto the canvas.
Then, I label the symbol “START”. This establishes an explicit entry point for the process.
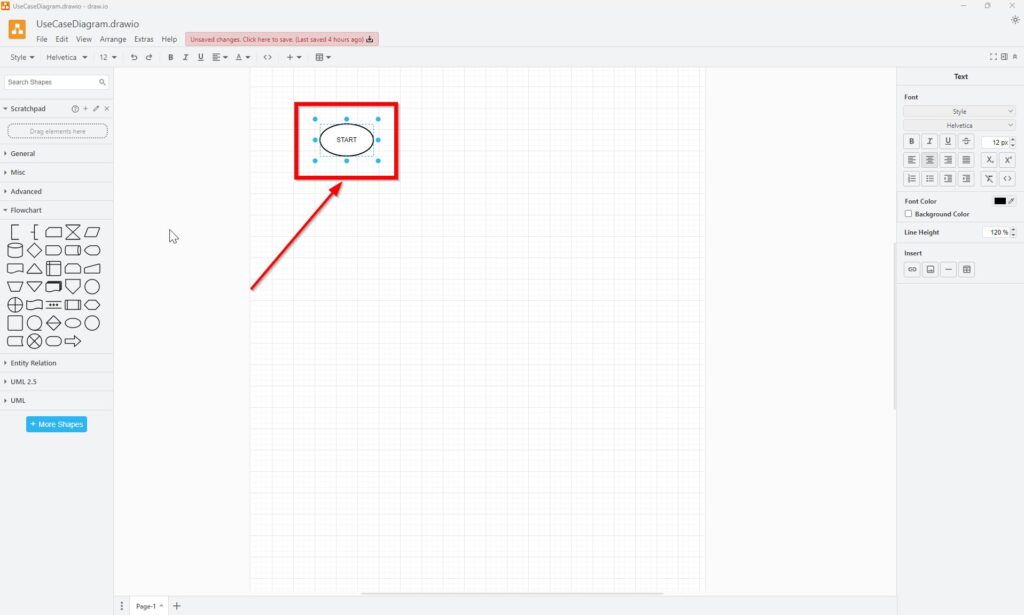
I give every flowchart a clear entry point so that readers immediately know where to begin.
3. Show the Direction of the Flow
After defining the start, I need to show what happens next. The screenshots use an arrow-shaped flowchart element for this purpose.
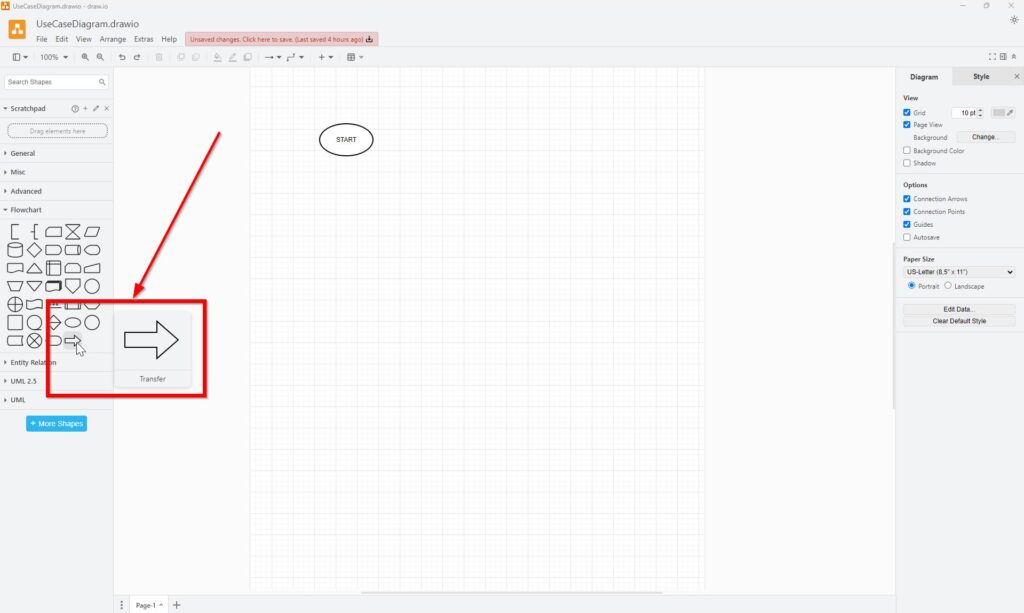
I position and rotate the arrow so that it points downward from the Start symbol.
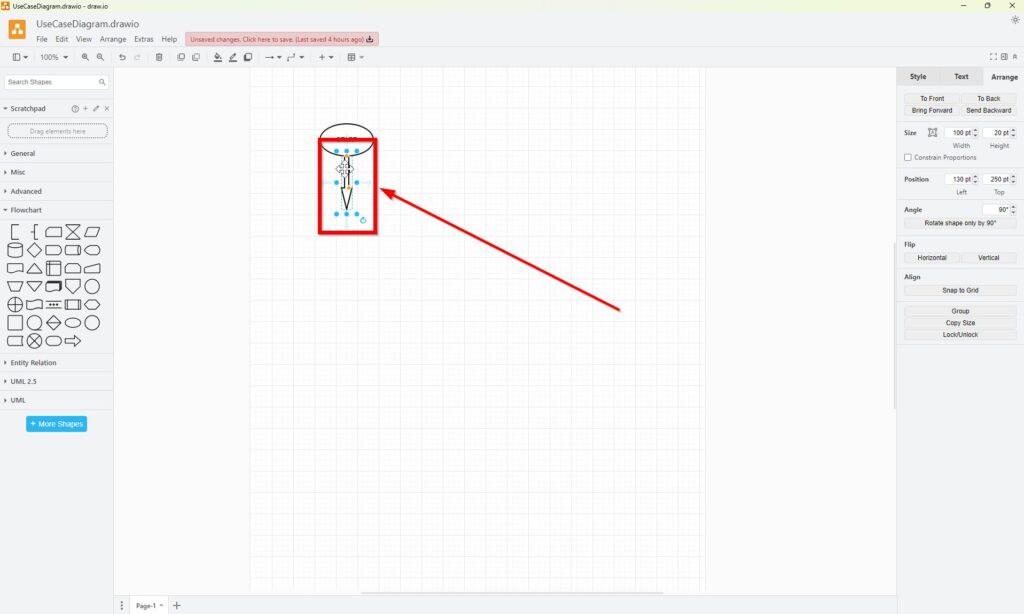
For simple examples, this approach works. However, I usually prefer draw.io connectors for larger diagrams. Connectors stay attached to shapes when I move them. Therefore, they make a diagram easier to maintain.
The connection between two symbols represents process flow, so its direction must remain unambiguous.
4. Add the First Process Step
Now I add an activity. I choose a Process symbol from the Flowchart library.
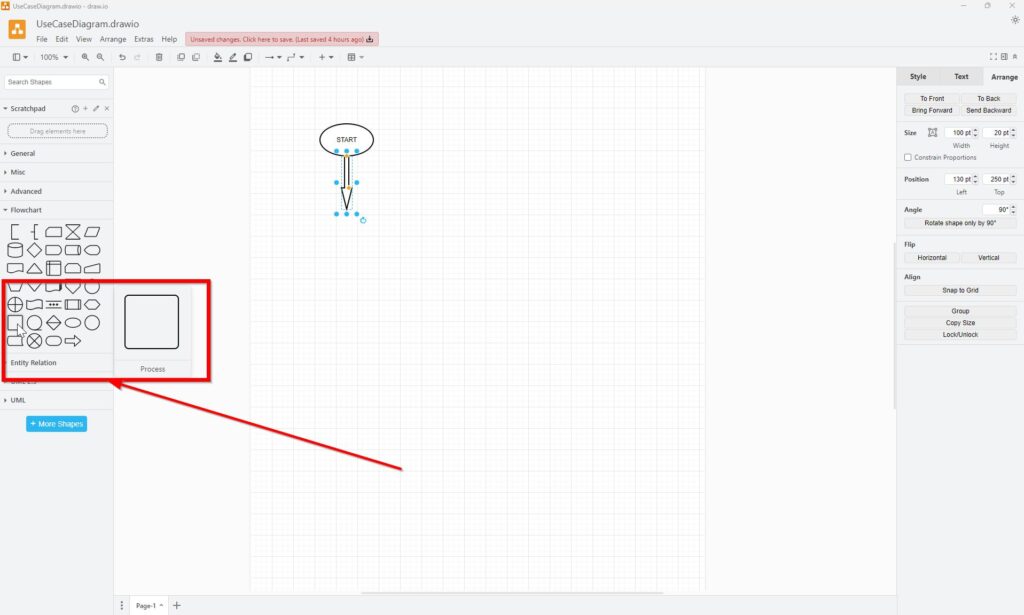
I place it below the start and label it “ALARM CLOCK RINGS”.
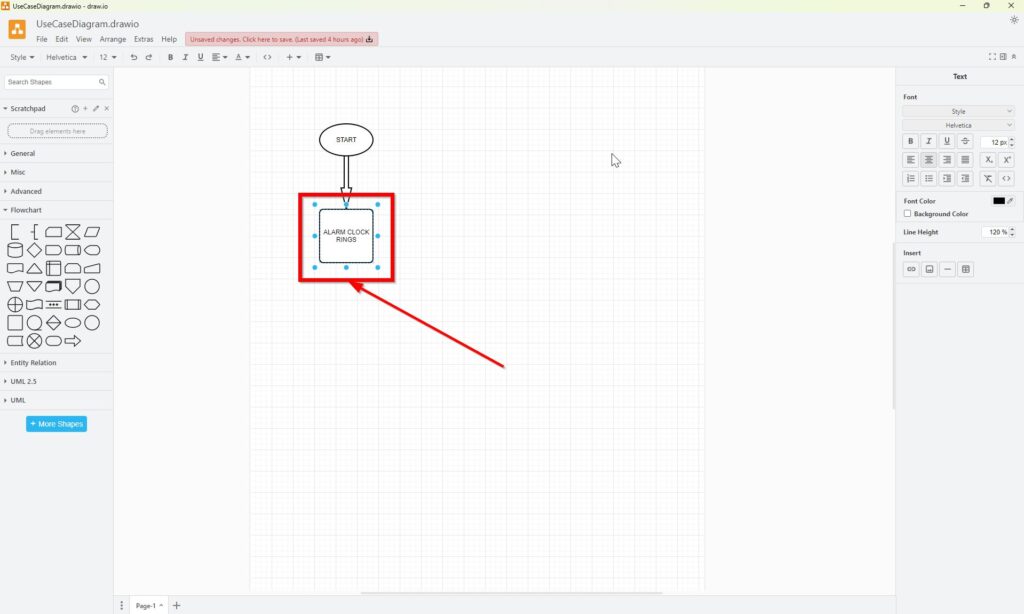
A process box answers a simple question: what happens at this point? Here, the alarm clock ringing is the event that leads to the next part of the routine.
5. Add a Decision
The process now reaches a choice. Therefore, I add a Decision symbol.
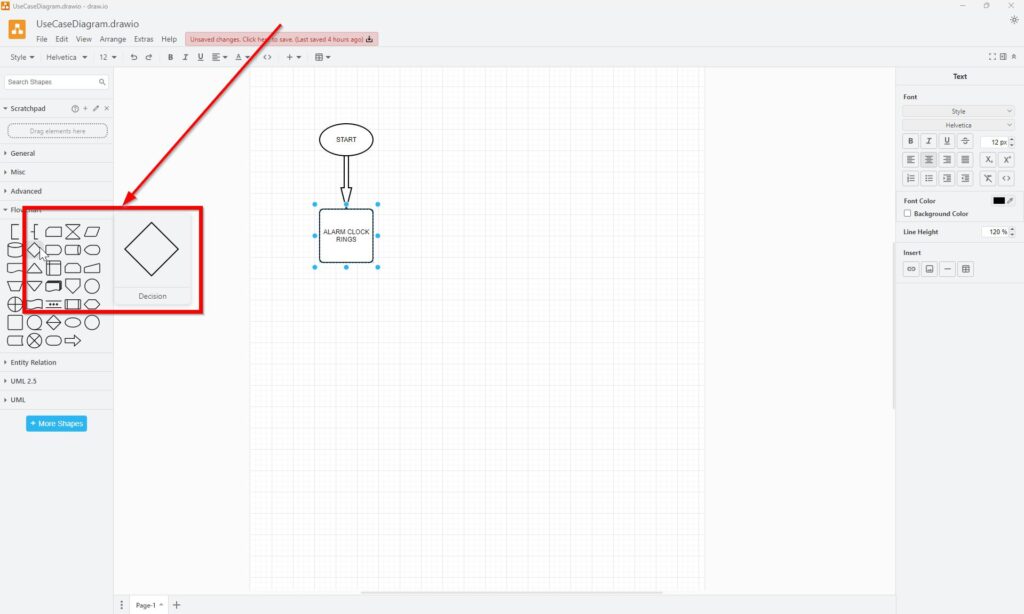
I label the decision “READY TO GET UP?”. Then, I connect it to the previous process step.
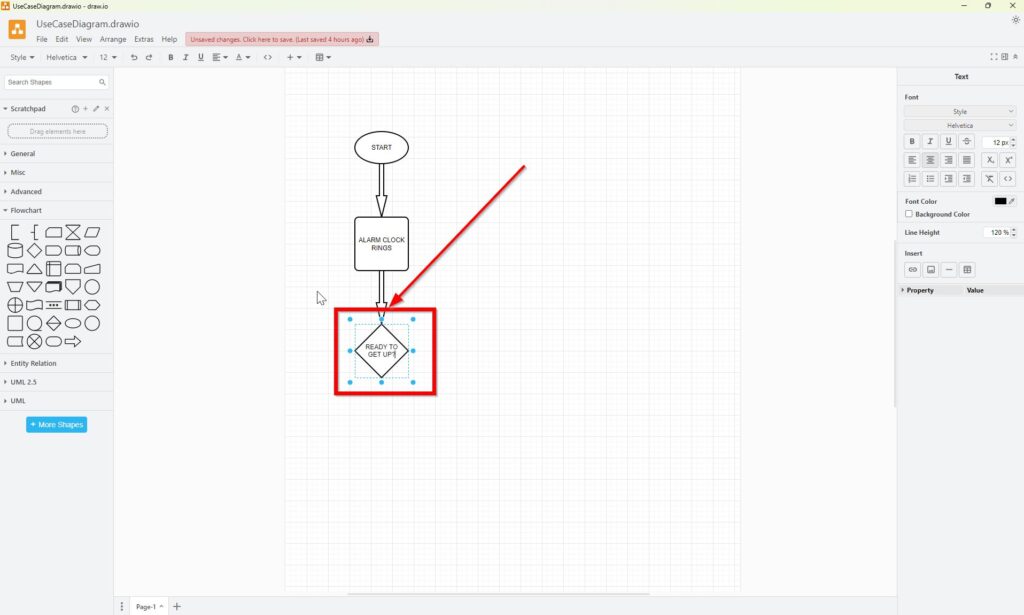
The diamond is important because the flow no longer has only one possible continuation. Instead, the answer determines which path the process follows.
A decision should express a question or condition whose possible outcomes lead to different paths.
6. Model the Main Path
If the answer is yes, the person gets out of bed. Consequently, I add another Process symbol and label it “GET OUT OF BED”.
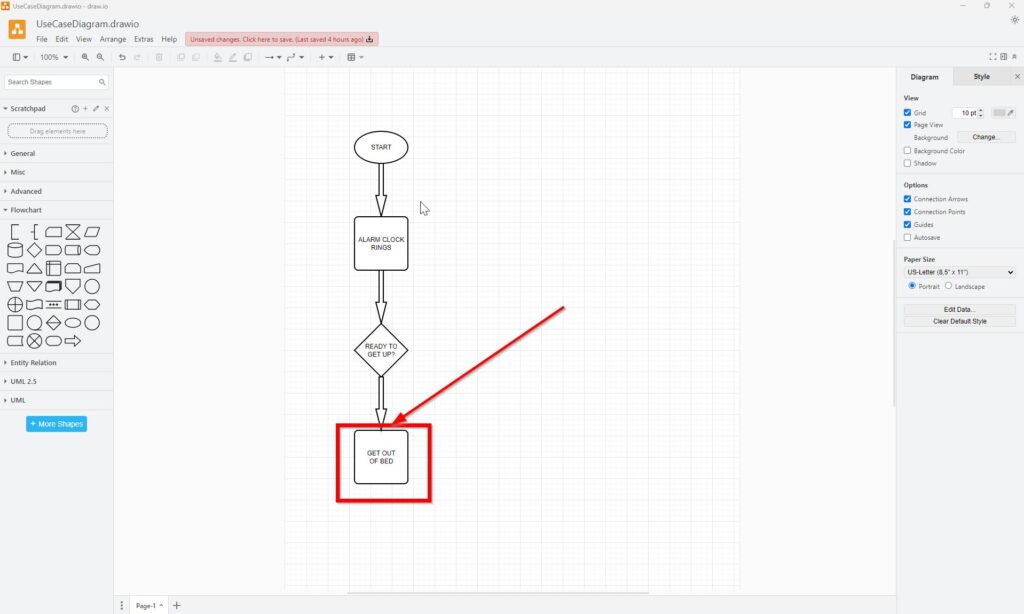
This branch represents the straightforward completion of the routine. However, the diagram still needs an explicit endpoint.
7. End the Process
Next, I choose the Terminator symbol.
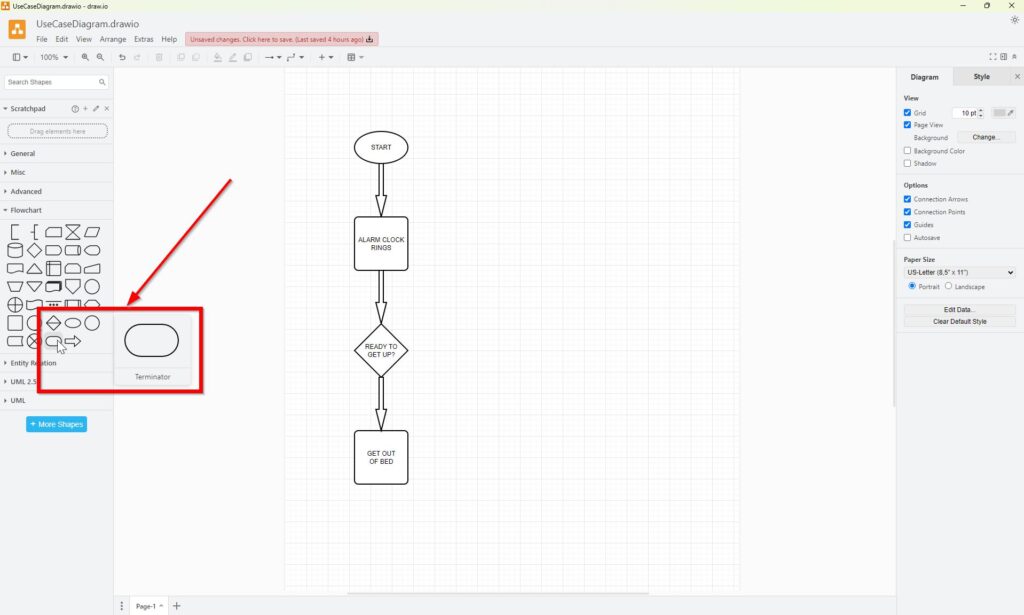
I place it below the final process and label it “END”.
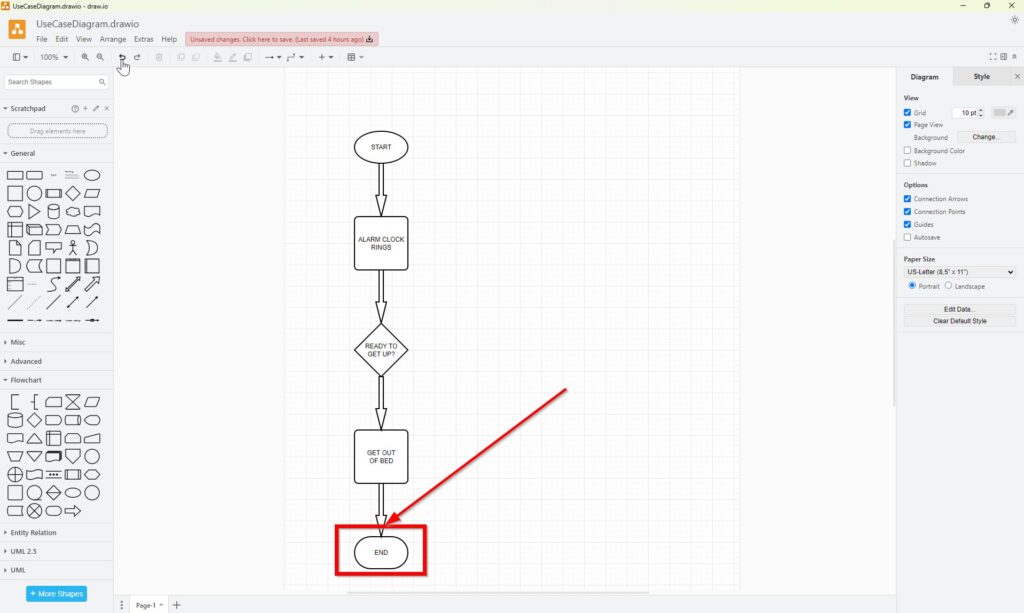
Now the primary sequence is complete:
START → ALARM CLOCK RINGS → READY TO GET UP? → GET OUT OF BED → END.
However, the decision still has only one modeled outcome. Therefore, I add the alternative path next.
8. Build the Snooze Loop
If the answer to “READY TO GET UP?” is no, the person presses the snooze button.
I add a Process symbol for “HIT THE SNOOZE BUTTON”. Then, I add a Delay symbol to represent the waiting period before the alarm rings again.
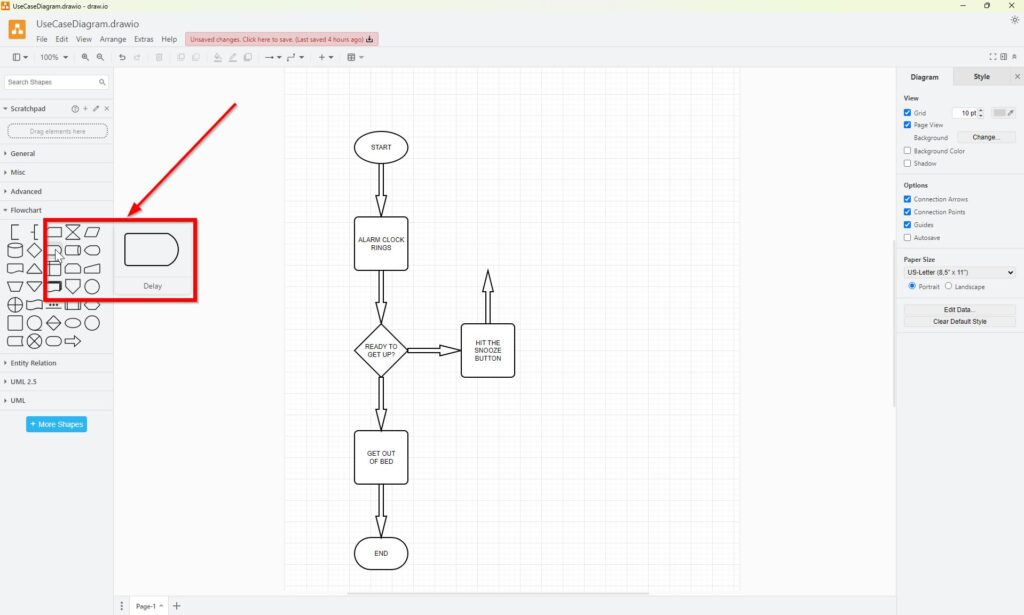
The snooze path does not terminate. Instead, it returns to an earlier point. This creates a loop.
That loop expresses an important part of the process semantics:
NO → HIT THE SNOOZE BUTTON → SNOOZE → ALARM CLOCK RINGS.
The decision will then occur again.
A loop shows that a process can repeat until a condition changes.
9. Label the Decision Paths
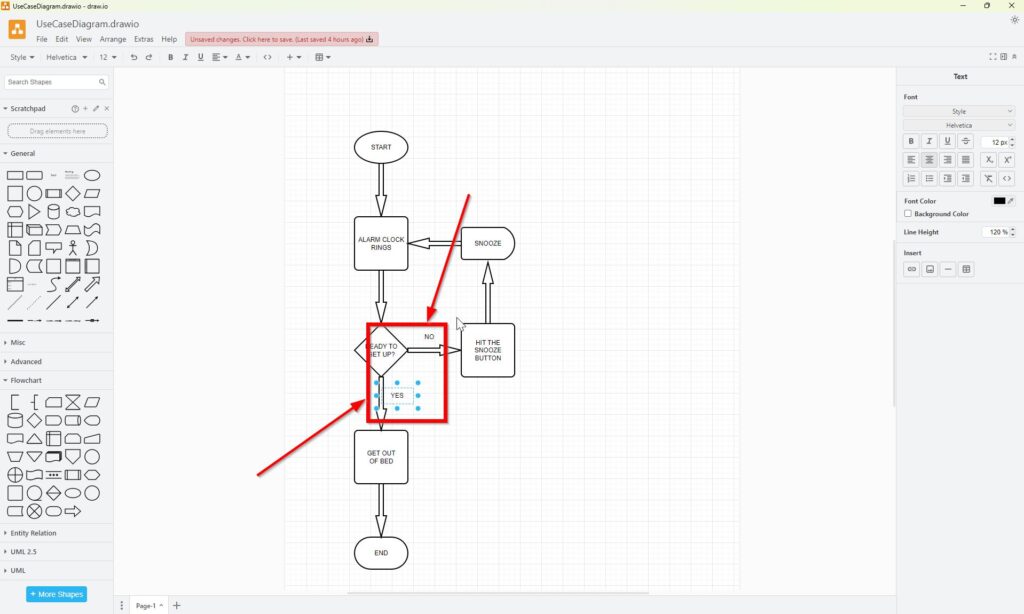
A decision diamond becomes difficult to interpret if I do not identify its outgoing paths. Therefore, I label the two branches “YES” and “NO”.
The screenshots use Text elements from the General library.
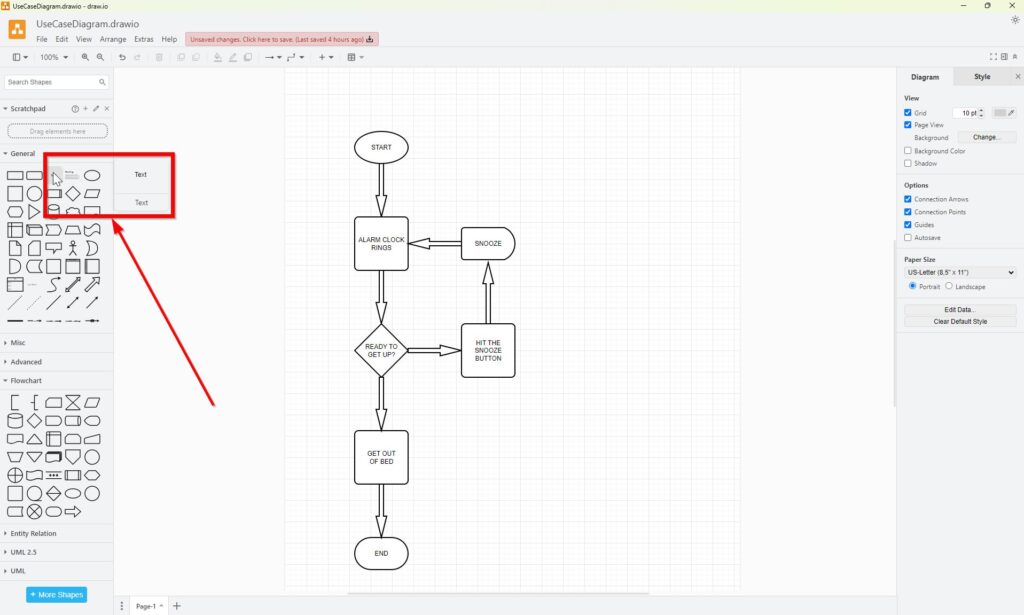
I position the labels beside the corresponding paths. “YES” leads toward “GET OUT OF BED”. “NO” leads toward “HIT THE SNOOZE BUTTON”.
Place Image 15 here if you want to retain every original screenshot.
Caption: Text elements provide labels for the YES and NO branches of the decision.
Alt text: Draw.io General library showing the Text element used for decision path labels.
Finally, I place the labels close enough to their paths that readers cannot confuse them.
For larger diagrams, I often label the connector itself instead of using a separate text element. Then, the label remains associated with the connection when I rearrange the diagram.
Every decision path should make its condition or outcome clear.
The Completed Flowchart
The finished model now contains a start, activities, a decision, two alternative paths, a delay, a loop, and an end.
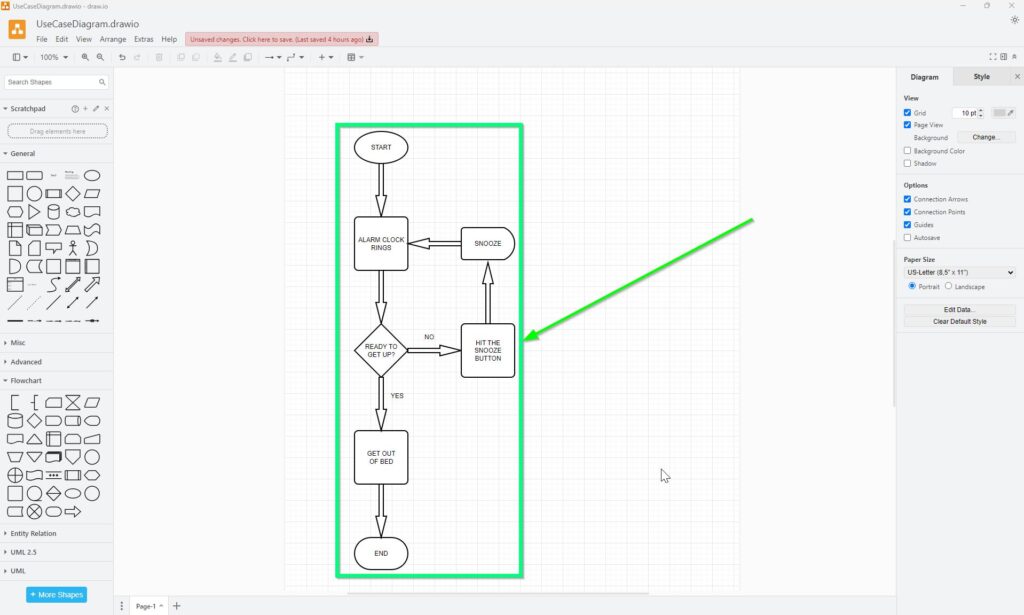
The logic is simple:
- The process starts.
- The alarm clock rings.
- I evaluate whether I am ready to get up.
- If yes, I get out of bed and the process ends.
- If no, I press the snooze button.
- I wait through the snooze period.
- The alarm rings again.
- The decision repeats.
Because the diagram separates actions from decisions, I can understand this logic much faster than I could from a paragraph alone.
How I Keep Flowcharts Clear
I use a few basic rules whenever I create a flowchart.
First, I keep one main reading direction whenever possible. In this example, the main path runs from top to bottom.
Second, I use different symbols only when their meanings differ. A process is an action. A decision creates alternative paths. A terminator marks a start or end. A delay represents waiting.
Third, I label decision branches explicitly. Otherwise, the reader must guess why the process moves in one direction instead of another.
Finally, I avoid unnecessary visual elements. Decorative shapes do not improve process logic. Clear structure does.
The purpose of a flowchart is not to display as many symbols as possible. Its purpose is to communicate process logic with as little ambiguity as possible.
Conclusion
I use draw.io flowcharts when I need a compact view of sequential logic. Even this small example demonstrates the essential concepts: start and end points, activities, decisions, alternative paths, and loops.
Once I understand these concepts, I can apply the same method to more complex workflows. For example, I can model business procedures, software logic, approval processes, troubleshooting sequences, or user interactions.
A useful flowchart turns process logic into a visual structure that I can inspect, explain, and improve.
What’s Next?!
Now that I know how making a flowchart with draw.io helps me explain process logic, I can move to a more structured modeling topic. Flowcharts are great for simple steps, but UML classes help me describe system structures, attributes, and relationships. In the next article, I’ll explain Syntax and Semantics of UML Classes in draw.io. You’ll learn what UML class elements mean and how they help you create clearer software models. Click below to continue and explore UML class modeling in draw.io.
Build Clearer Requirements with the Right Tools
Requirements engineering becomes easier when I use tools that support visual thinking, documentation, coordination, and process modeling. Therefore, I use draw.io to create diagrams, Confluence to organize knowledge, Jira to manage requirements-related work, and Camunda to model business processes. Each tool helps me structure complexity in a practical way. As a result, I can connect ideas, decisions, tasks, and workflows more clearly. In the main article on Requirements Engineering Tools, I show how these tools work together and support stronger requirements work from start to finish.
| Read more about draw.io |
|---|
| PDF Export VSDX Export HTML Export URL Export XML Export |