
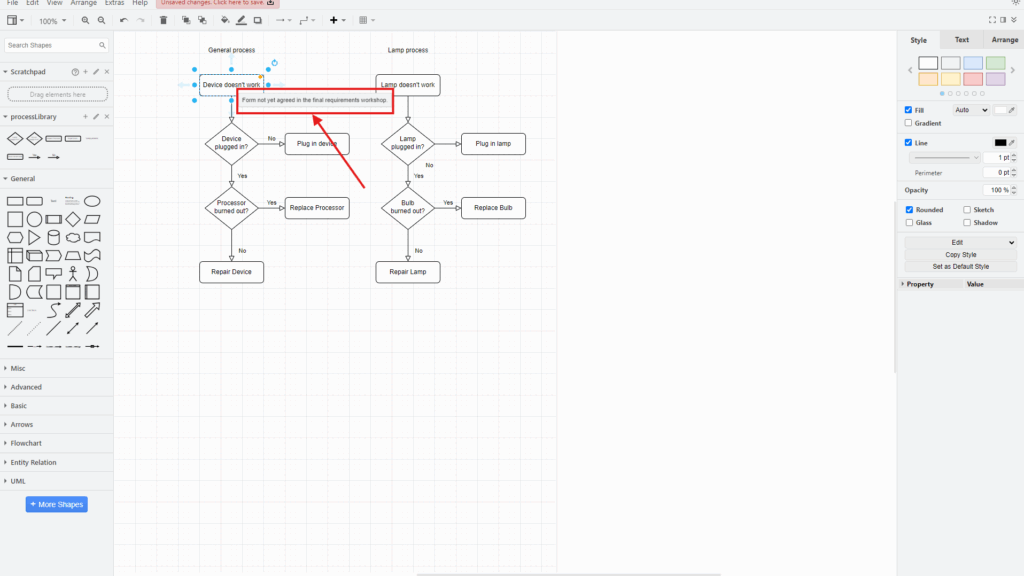
The Tooltip in draw.io helps me add extra context without cluttering my diagram. I use it when shapes or connectors need short explanations. When someone hovers over an element, the tooltip shows helpful text. In this guide, I explain how to edit tooltips and why they can make diagrams easier to understand, especially in business cases.
What Is a Tooltip in draw.io?
A tooltip is additional text that I attach to an element in a diagram in draw.io. The text does not appear permanently on the canvas. Instead, draw.io displays it when a user hovers over the element.
A tooltip lets me add context without changing the visible structure of the diagram.
For example, I can use a tooltip to explain:
- an assumption behind a process step
- an unresolved requirement
- a technical restriction
- the meaning of an abbreviation
- additional information that would make the visible label too long
However, I do not use tooltips for information that every reader must see immediately. Important process logic, decisions, labels, and relationships belong directly in the diagram.
How to Edit a Tooltip in draw.io
I can create or change a tooltip in four steps.
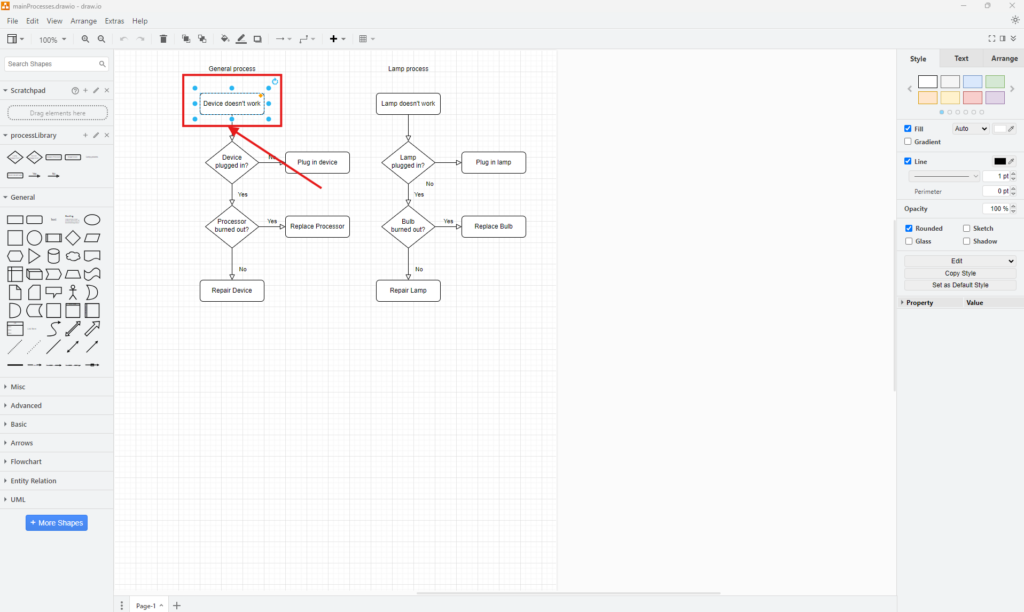
1. Select the Element
First, I select the shape or connector that needs additional information.
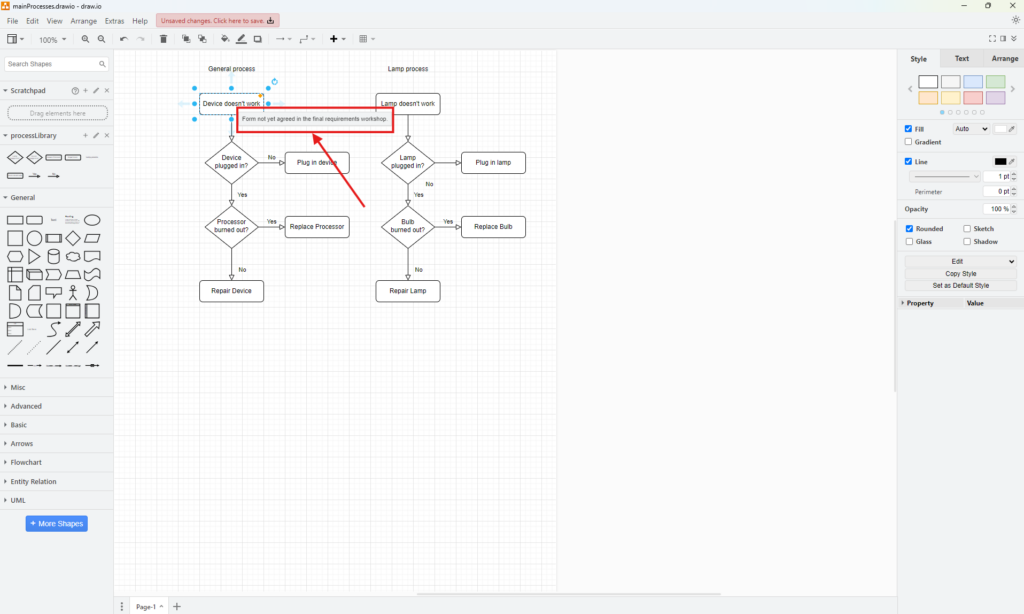
In this example, I select the process step “Device doesn’t work.”
The tooltip always belongs to the selected diagram element.
2. Open Edit Tooltip
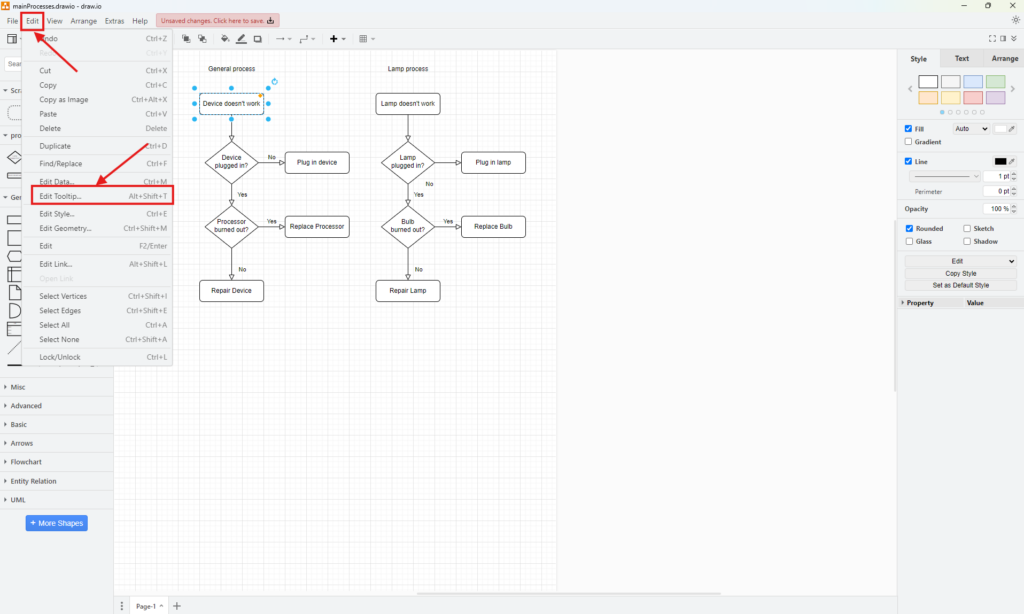
Next, I open the Edit menu and select Edit Tooltip.
Alternatively, I can use the keyboard shortcut Alt+Shift+T.
draw.io then opens the tooltip editor for the selected element.
3. Enter the Tooltip Text
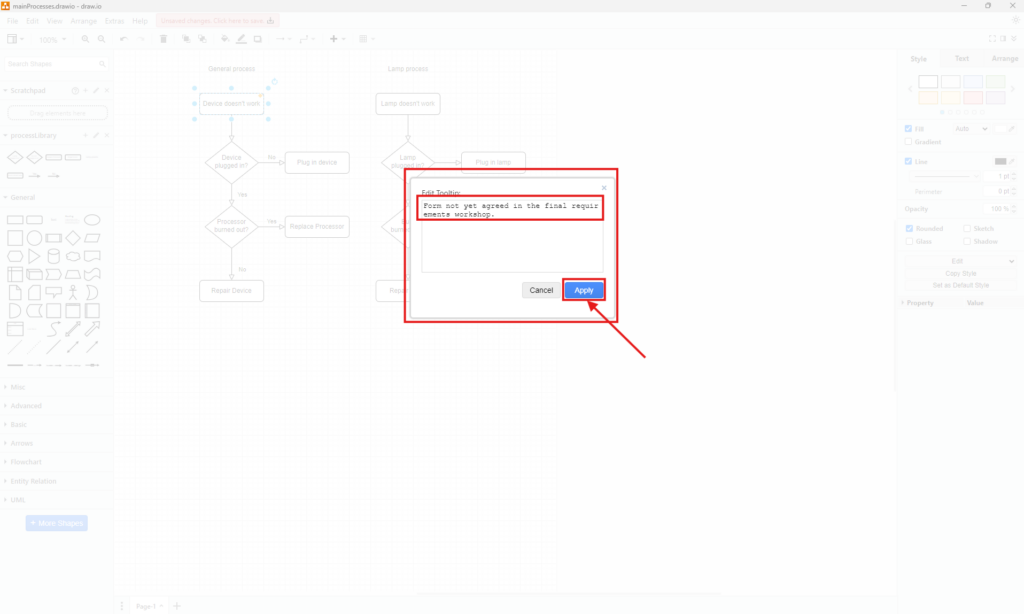
I enter the additional information in the dialog.
For example:
“Form not yet agreed in the final requirements workshop.”
Then I select Apply.
I keep tooltip text short and specific because it should provide additional context, not become hidden documentation.
4. Check the Tooltip
Finally, I hover over the element.
draw.io displays the tooltip next to the shape. Therefore, I can verify both the text and the element to which I attached it.
When I Use Tooltips
Tooltips work especially well when information is useful but not essential to understanding the diagram.
For example, I may model a business process in which one activity depends on an assumption that the project team has not yet confirmed. Adding that uncertainty directly to the activity label would make the process harder to read. A tooltip can preserve the information without increasing the visual complexity.
Similarly, I can use tooltips for short modeling notes or definitions.
However, I distinguish between supplementary and essential information.
If readers need information to interpret the diagram correctly, I show it directly in the diagram rather than hiding it in a tooltip.
This distinction matters because readers may print, export, or view the diagram in a format that does not support interactive hover behavior. For example, a static image cannot reproduce an interactive tooltip.
How I Write Useful Tooltips
I treat each tooltip as a short annotation. Therefore, I write complete and precise statements.
For example:
Weak tooltip:
“Needs clarification.”
Better tooltip:
“Customer approval process has not yet been agreed.”
The second version explains what remains unclear. As a result, another reader can understand the issue without additional context.
I also avoid long paragraphs. If an element requires extensive documentation, I use a dedicated specification, comment, linked document, or another appropriate documentation mechanism instead.
A good tooltip answers one specific question about one specific diagram element.
Tooltips Should Support the Diagram, Not Replace It
Tooltips can make a diagram more informative. Nevertheless, they should remain secondary information.
A process model should still communicate its main meaning without them. The same principle applies to flowcharts, architecture diagrams, UML models, and other visual models.
Therefore, I first make the visible diagram understandable. Then I add tooltips only where extra context provides genuine value.
Conclusion
Editing a tooltip in draw.io is simple. I select an element, open Edit > Edit Tooltip, enter the text, apply it, and verify the result by hovering over the element.
More importantly, I use tooltips selectively. They help me record assumptions, open questions, definitions, and short explanatory notes while keeping the diagram readable.
I use a tooltip for supplementary context, but I keep essential information visible in the diagram itself.
What’s Next?
Now that I know how the Tooltip in draw.io adds helpful context to shapes and connectors, I can take the next step. Tooltips become even easier to manage when I know how to activate the tooltips view. In the next article, I’ll explain How to Activate the Tooltips View in draw.io. You’ll learn how this view helps you display, review, and manage tooltip information more clearly. Click below to continue and make your draw.io diagrams easier to explain.
Connect Tools for Better Requirements Engineering
Requirements engineering becomes more effective when I use tools that support clear thinking, documentation, planning, and process modeling. Therefore, I use draw.io to visualize ideas, Confluence to structure knowledge, Jira to manage requirements-related work, and Camunda to model business processes. Each tool adds value to a different part of the workflow. As a result, I can connect diagrams, decisions, tasks, and processes more clearly. In the main article on Requirements Engineering Tools, I show how these tools work together and support a stronger requirements engineering process.