
Embedding a diagram on a website should be simple and useful. That is why I explain How to embed an IFrame draw.io diagram in this guide. You’ll learn the step-by-step process, the benefits of iframe embedding, and how this method can improve sharing, presentation, and collaboration in real business use.
If you’d prefer to watch a video on this topic, click here:
What is draw.io?
Draw.io is an intuitive diagramming tool. Thus, it’s perfect for creating flowcharts, organizational charts, network diagrams, and more. The platform offers a seamless way to visualize data and concepts. Whether you’re managing projects or designing workflows, draw.io has you covered. Plus, you can save your diagrams as images or SVG files. But today, we’ll focus on embedding your diagrams as IFrames.
How to Embed an IFrame draw.io Diagram
How to Embed an IFrame draw.io Diagram is useful when I want to show an interactive diagram directly on a website. An IFrame can preserve functions such as zoom, layers, tags, links, and lightbox viewing. Depending on the selected access mode, it can also reference an online diagram instead of a separate static image. In this guide, I show the complete process step by step. Moreover, I explain the relevant settings for access, dimensions, appearance, links, editing, and viewer controls.
Why I Embed a draw.io Diagram as an IFrame
An IFrame displays a separate web resource inside my page. Therefore, it can provide more interaction than a PNG or other static image.
For example, viewers may zoom, open links, inspect layers, or use a lightbox.
If the IFrame references an online diagram, later changes may also appear without replacing an uploaded image. However, this depends on the selected access and storage method.
I use an IFrame when browser-based interaction matters more than a simple static diagram.
Step-by-Step Guide
Step 1: Export the Diagram as IFrame Code
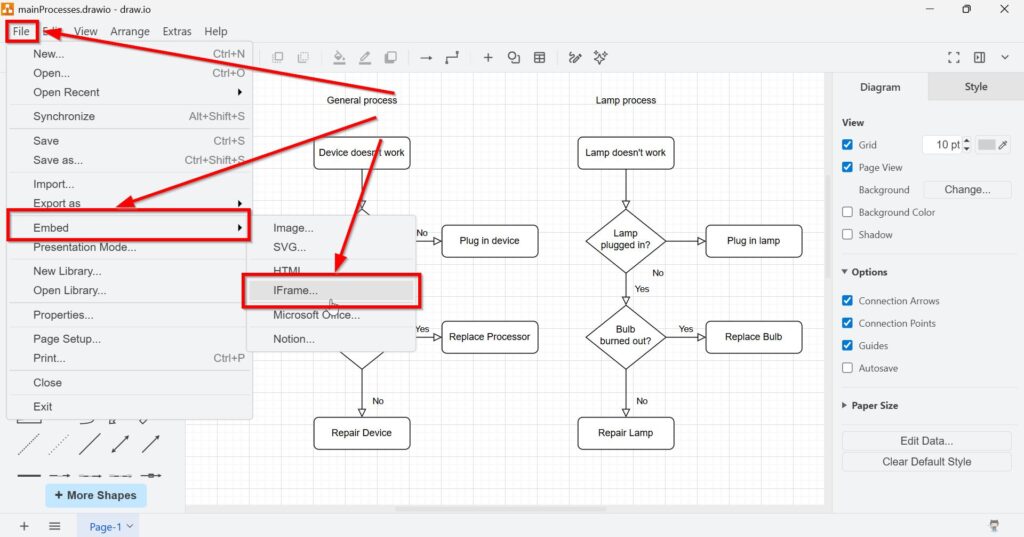
First, I open the diagram that I want to embed.
Then, I select File > Embed > IFrame.
Draw.io opens the IFrame configuration dialog.
Step 2: Configure the IFrame
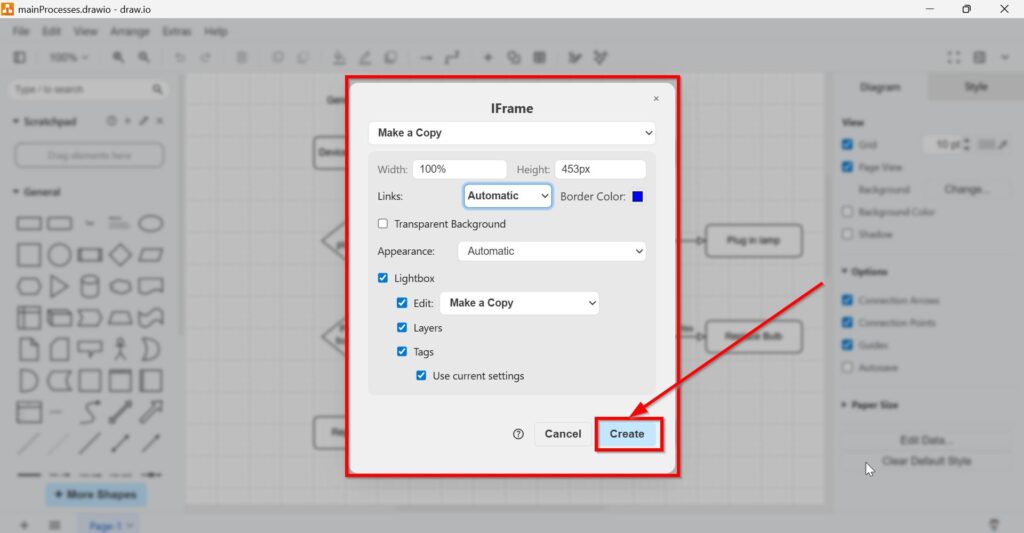
Next, I choose how viewers should access and use the embedded diagram.
Access Mode
The available access options may include Make a Copy, Authorization required, and Public URL of the diagram.
Make a Copy lets viewers create their own copy.
Authorization required limits access to authorized users.
Public URL uses a shareable diagram URL when the storage and permission settings support it.
I check the underlying sharing permissions before I publish the IFrame because the embed itself does not replace access control.
Dimensions
Width defines the horizontal size of the IFrame.
For example, I can use 100% when I want the diagram to use the available page width.
Height defines the vertical size. For example, I may use 453 pixels.
I choose dimensions that keep labels readable without creating unnecessary scrolling.
Links
The Links setting controls how links inside the diagram open.
Automatic uses the default behaviour.
Open in New Window opens the destination separately.
Open in This Window opens it in the current browser context.
Therefore, I select the behaviour that best fits my website.
Border Color
I can define a border colour around the embedded viewer.
However, I normally keep the border subtle so the diagram remains the focus.
Transparent Background
A transparent background lets the surrounding website background show through.
This can help the diagram fit more naturally into the page design.
Appearance
I can choose Light, Dark, or Automatic.
Automatic follows the available default behaviour. In contrast, Light and Dark force a specific appearance.
I choose the option that gives the best contrast for text, connectors, and shapes.
Lightbox
Lightbox lets viewers open the diagram in a larger overlay.
I use it especially for complex diagrams with small labels or many elements.
Edit Option
The Lightbox editing controls can provide additional actions.
Make a Copy lets viewers create an editable copy.
Custom lets me define another destination when the option is available.
I enable editing only when viewers actually need it.
Custom URL
If I choose Custom, draw.io opens a field where I can enter another URL.
Therefore, I can direct the editing action to a specific destination.
Layers
Layers lets viewers access diagram layers when the embed supports them.
This can help me provide different levels of detail in one diagram.
Tags
Tags can support navigation or selective display when I use them in the source diagram.
However, I enable them only when they add useful structure.
Use Current Settings
Use current settings applies the relevant viewer settings that already exist in the diagram.
This can save configuration work when I have already prepared the diagram for presentation.
I enable only the controls that improve the viewer experience and keep unnecessary options hidden.
Finally, I click Create.
Step 3: Copy the IFrame Code
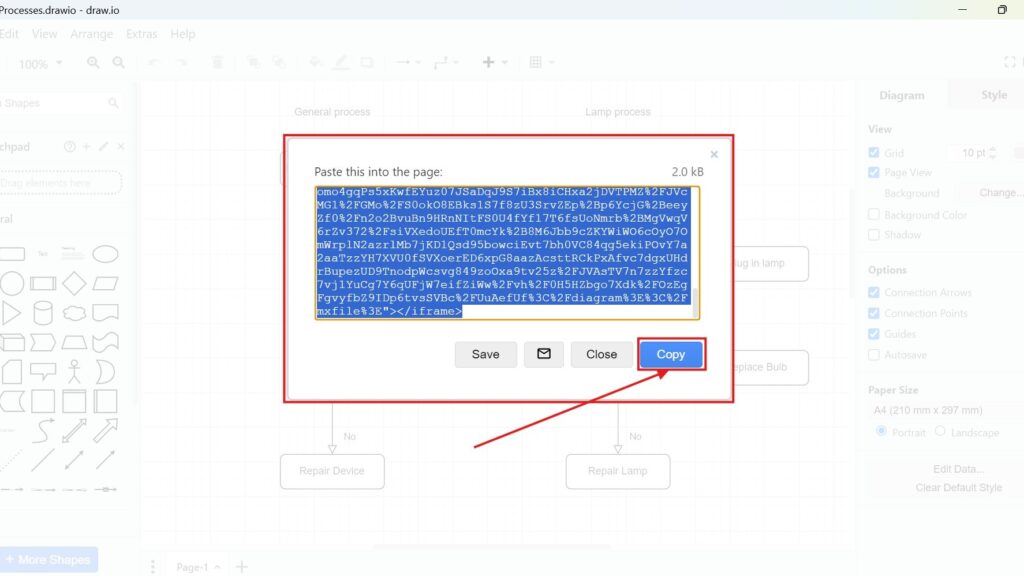
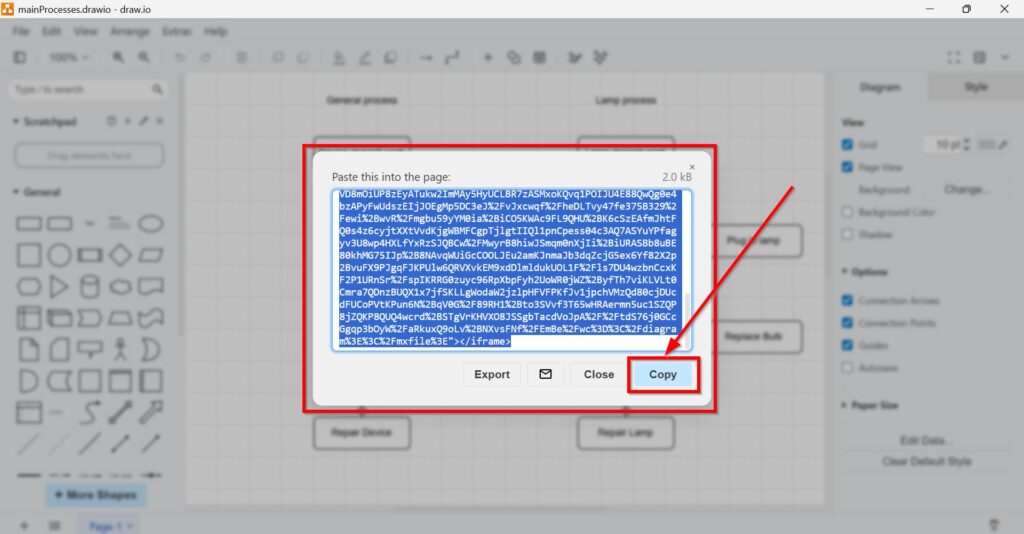
Draw.io now generates the IFrame code.
I click Copy to place it on my clipboard.
I keep the original draw.io file as my editable source. Therefore, I treat the generated IFrame code as publication output.
Keeping one source diagram makes later updates and version control easier.
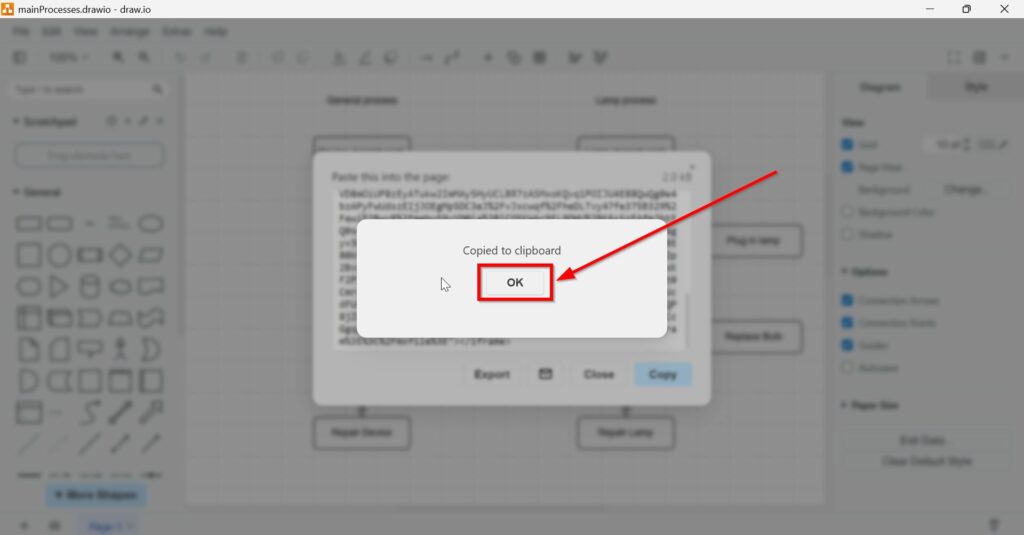
Step 4: Embed in Your Website
Finally, I open the page where I want to display the diagram.
Then, I paste the generated IFrame code into an HTML area.
For example, in WordPress I can use a Custom HTML block. During testing, I may also use a simple HTML page so I can check the embed without other page elements interfering.

Afterwards, I preview the page.
I check the width, height, readability, links, lightbox, layers, tags, background, and editing options.
Moreover, I test the page on smaller screens when mobile use matters.
I always test the finished IFrame in its real website environment before I publish it.

When I Use an IFrame Instead of Another Embed
I choose an IFrame when I want a browser-based viewer with interactive controls.
In contrast, I use an image embed when I only need a visual representation. I use SVG when scalability matters, while PDF works better for fixed documents and printing.
Therefore, the best method depends on how visitors need to use the diagram.
Access and Updates
An IFrame can reference an online diagram. In that case, updates to the referenced source may appear in the embedded view.
However, this behaviour depends on the storage location, sharing method, and selected access mode.
Therefore, I do not assume that every IFrame updates automatically.
I verify both access permissions and update behaviour before I rely on an embedded diagram in permanent documentation.
Final Thoughts
To embed a draw.io diagram as an IFrame, I select File > Embed > IFrame, configure the access and viewer settings, create the code, copy it, and paste it into my website.
The main settings control access, dimensions, links, appearance, lightbox behaviour, editing, layers, and tags.
A well-configured IFrame gives me an interactive way to display draw.io diagrams directly inside a website while keeping viewing and access options under control.
What’s Next
If I want to use draw.io diagrams even more effectively, the next step is to bring them directly into my daily Office workflow. That is why learning how to add the draw.io add-on to Microsoft Office makes so much sense. It helps me work with diagrams inside familiar tools like Word, PowerPoint, and Excel. In the next guide How to Add the draw.io Add-on to Your Microsoft Office Apps, I show exactly how to set this up and start using it in practice.
Explore Requirements Engineering Tools in Practice
Requirements engineering becomes clearer when I use tools that support visual thinking, documentation, coordination, and process modeling. Therefore, I use draw.io to create diagrams, Confluence to structure knowledge, Jira to manage requirements-related work, and Camunda to model business processes. Each tool supports a different part of the workflow. As a result, I can connect ideas, decisions, tasks, and processes more effectively. In the main article on Requirements Engineering Tools, I show how these tools work together and help me build a stronger requirements engineering process.
| Read mora about draw.io |
|---|
| Import PNG Export JPEG Export WebP Export SVG Export |