
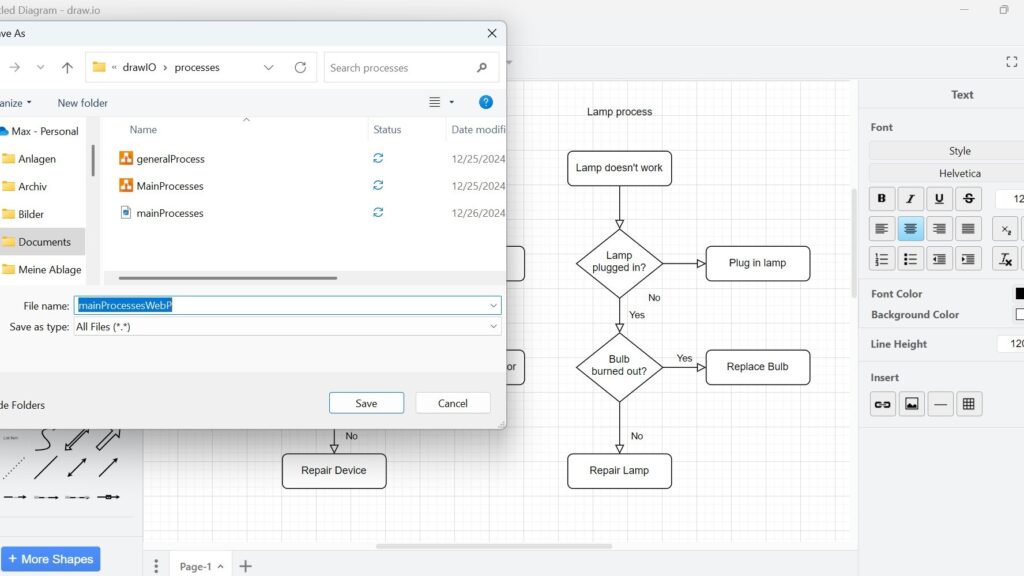
Choosing the right format matters when I share diagrams online. WebP can reduce file size while keeping good visual quality. In this guide, I explain How to Export a Diagram to WebP in draw.io. You’ll learn the basic steps, useful options, and why WebP can improve your diagram workflow for web content.
Prefer watching instead of reading? Here is the quick video walkthrough:
What is draw.io?
draw.io is a powerful online tool for creating and editing diagrams. Whether you’re sketching out a simple flowchart, mapping a complex network, or planning a business process, draw.io has you covered. It supports collaboration, integrates seamlessly with platforms like Google Drive and GitHub, and offers a range of export options—including WebP. The WebP format is perfect for web-based diagrams due to its small size and high quality.
Exporting a Diagram to WebP in draw.io
1. Step: Open Your Diagram in draw.io
I open the diagram that I want to export. Then, I check whether all elements appear correctly.
I also review labels, connectors, and the overall layout. The exported WebP reflects the visual state of my diagram at the time of export.
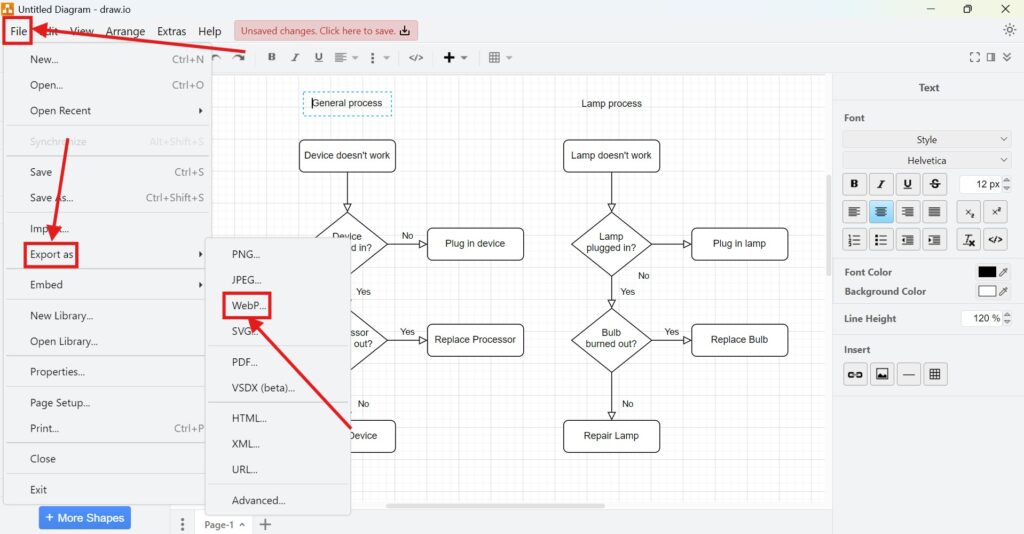
2. Step: Select File > Export as > WebP
I open the File menu. Then, I select Export as and choose WebP.
This command opens the WebP export settings before draw.io creates the image.
3. Step: Configure the WebP Export
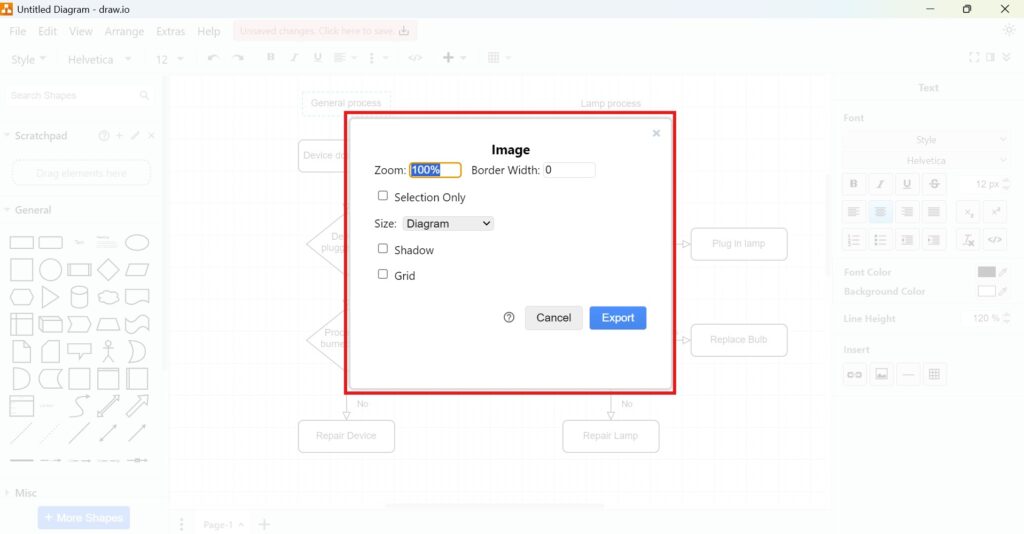
I now adjust the export settings according to my intended use.
Zoom: I change the zoom percentage to make the exported diagram larger or smaller.
Border Width: I define additional space around the outside of the diagram.
Selection Only: I enable this option when I want to export only the currently selected elements.
Size: I choose whether the image should contain the full diagram or use the current page.
Shadow: I enable this option when I want the exported shapes to include their shadows.
Grid: I enable this option when I want the drawing canvas grid to appear in the WebP image.
I choose the export settings according to how and where I plan to use the image.
For most published diagrams, I focus on readable text and appropriate dimensions. Therefore, I avoid increasing the image size without a clear reason.
4. Step: Export and Save the WebP File
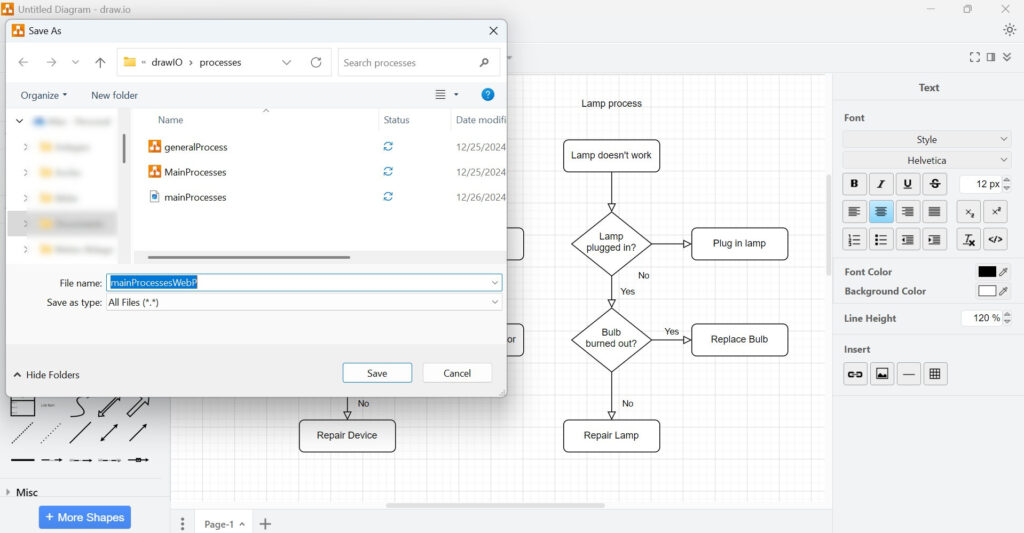
After I finish the settings, I click Export. Then, I enter a filename and choose the required save location. Finally, I confirm the export.
The resulting file uses the WebP image format and is ready for use on a website or in other digital content.
Which WebP Settings Should I Use?
I adjust the settings instead of using one configuration for every diagram. A small diagram may work well at its original scale. However, a detailed diagram may need a larger output so that labels remain readable.
Selection Only is especially useful when I need one section instead of the complete model. In addition, Border Width gives me control over the empty space around the image.
I normally include the grid only when it adds information. Otherwise, it can distract from the actual diagram.
The best WebP export keeps the diagram readable while avoiding unnecessary image size and visual elements.
Final Thoughts
WebP gives me a practical format when I want to publish a draw.io diagram as a raster image online. The export process only requires four steps. First, I open the diagram. Then, I select WebP, configure the settings, and save the file.
What’s Next?
Now that I know how to export a diagram to WebP in draw.io, I can move to a format that keeps diagrams sharp at every size. WebP works well for efficient web images, but SVG is ideal when I need scalable vector graphics. In the next article, I’ll explain How to Export a Diagram to SVG in draw.io. You’ll learn when SVG makes sense, how the export works, and why it helps you use crisp diagrams in websites, documents, and presentations. Click below to continue and export your draw.io diagram as an SVG file.
Use Tools That Clarify Requirements Engineering
Requirements engineering becomes easier when I use tools that support visual thinking, documentation, coordination, and process modeling. Therefore, I use draw.io to create clear diagrams, Confluence to organize knowledge, Jira to manage requirements-related work, and Camunda to model business processes. Each tool helps me turn complex information into a more useful structure. As a result, I can connect ideas, decisions, tasks, and workflows more effectively. In the main article on Requirements Engineering Tools, I show how these tools work together and support a stronger requirements engineering workflow.