
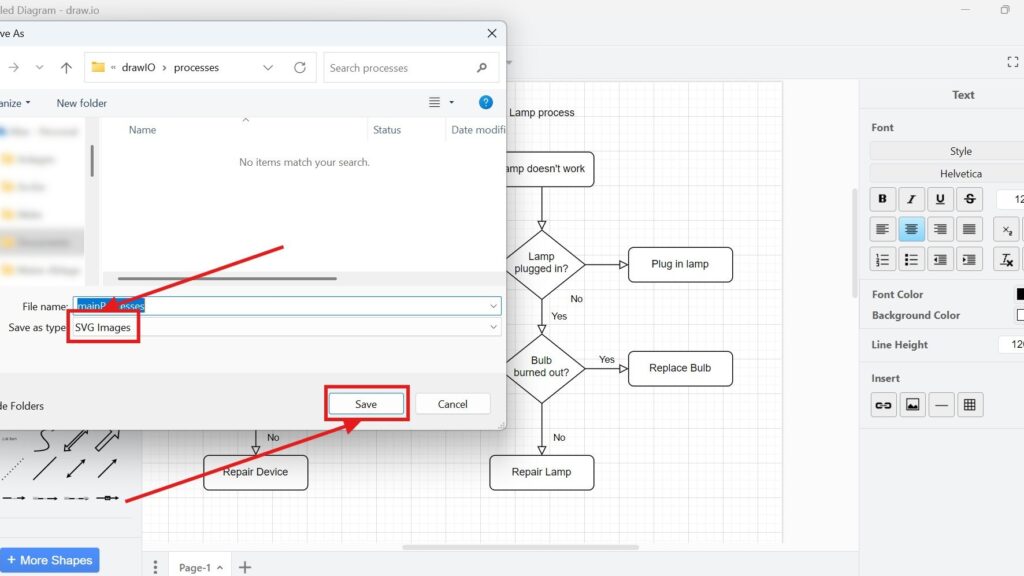
SVG keeps diagrams sharp at every size. That makes it useful for websites, documents, and presentations. In this guide, I explain How to export a diagram to SVG in draw.io. You’ll learn the basic steps, useful options, and why SVG helps you share scalable diagrams without losing quality.
Prefer watching instead of reading? Here is the quick video walkthrough:
What is draw.io?
First, let’s talk about draw.io (opens in a new tab). It’s a popular diagramming tool that’s both powerful and user-friendly. I use it to create flowcharts, network diagrams, and even complex architecture diagrams. The best part? It’s free and integrates seamlessly with tools like Google Drive and Microsoft OneDrive. Moreover, draw.io supports exporting diagrams in multiple formats, including PNG, PDF, and, of course, SVG. SVGs are particularly useful when you need scalable, high-quality visuals for websites, presentations, or print materials.
Steps to Export a Diagram to SVG
Exporting a diagram as an SVG requires only a few steps. However, I review the export settings before I save the file because they affect its size, appearance, and later use.
Step 1: Open the Diagram
First, I open the diagram that I want to export in draw.io.
Before I continue, I check the complete diagram once more. For example, I look for hidden objects, unnecessary empty space, or elements outside the intended page area.
I make these corrections before the export because the SVG should represent the finished diagram.
Step 2: Access the Export Menu
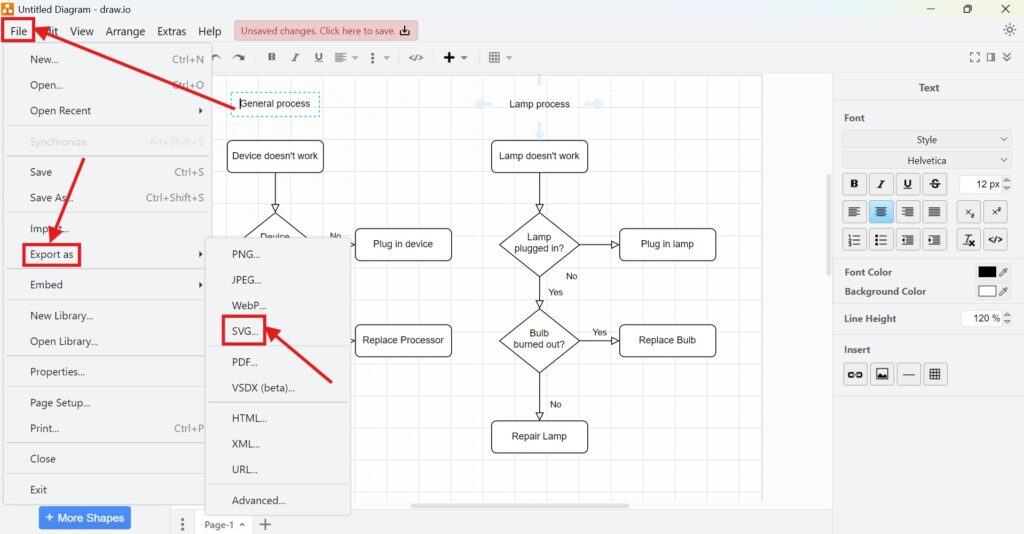
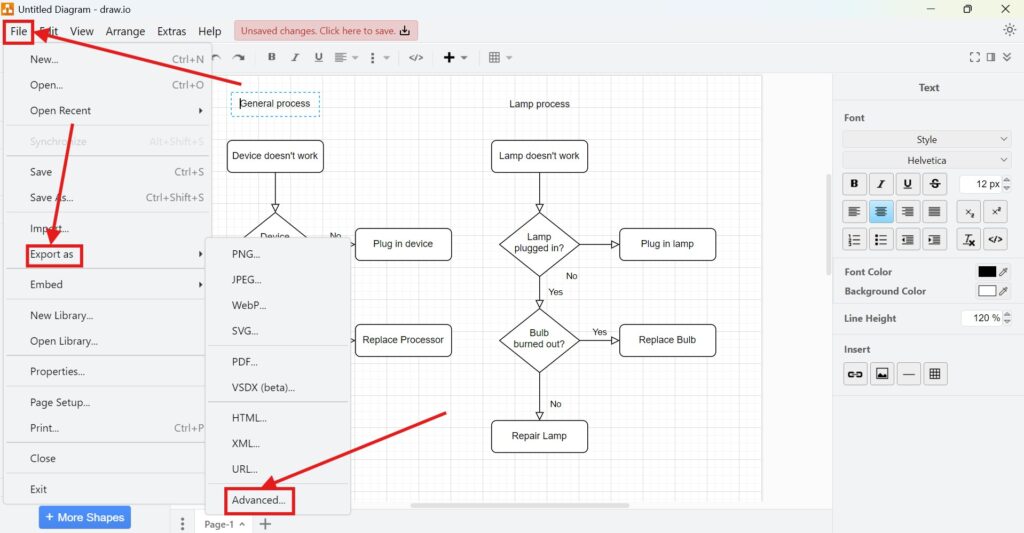
Next, I open File in the menu bar.
Then, I select Export as and choose SVG.
Draw.io opens the SVG export dialog. Therefore, I can define how the exported file should look before I create it.
Step 3: Configure Export Settings
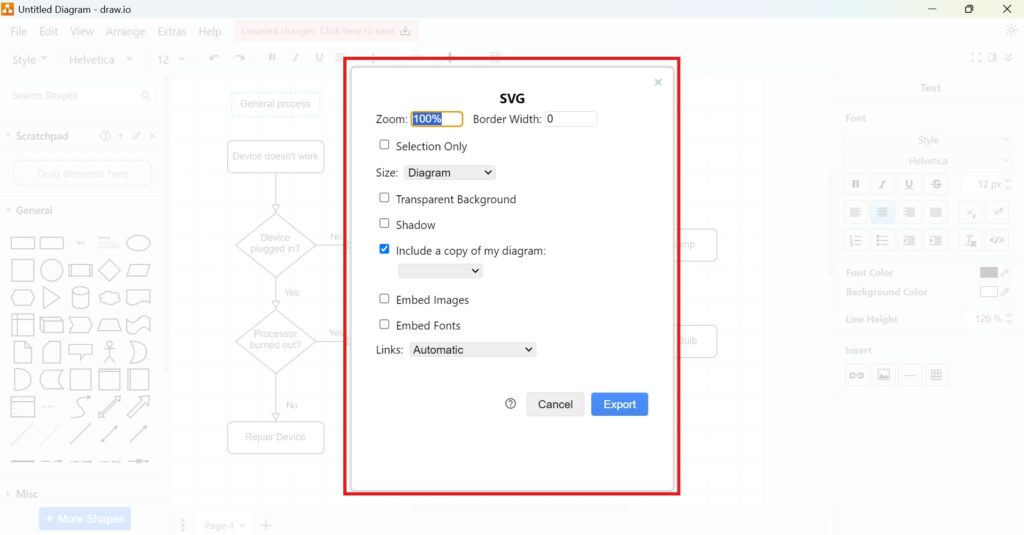
The export dialog contains several settings. I adjust only the options that support my intended use.
Zoom
I use Zoom to scale the exported diagram.
A higher value makes the SVG appear larger according to the selected export dimensions. However, SVG remains a vector format, so scaling does not create the same quality loss as enlarging a bitmap image.
Border Width
Border Width adds space around the diagram.
I normally keep this value small. However, I add more space when I want visual separation from surrounding text or other page content.
Selection Only
I activate Selection Only when I want to export only the elements that I selected before opening the export dialog.
This option helps when I need one section of a larger diagram. Therefore, I do not need to create a separate source file.
Size and Page Options
Depending on the diagram and export settings, I can control which content draw.io includes.
For example, I may export the current page or a selected part of the diagram.
I choose the smallest useful scope. As a result, the SVG contains only the content that I actually need.
Background
I use the background setting when I need a defined background colour.
For websites and documents, a transparent background can provide more flexibility. In contrast, a fixed background can prevent unexpected colour changes when other applications display the SVG.
Shadow
If the diagram contains shadows, I decide whether the SVG should preserve them.
I normally include them only when they contribute to the visual design. Otherwise, I prefer a simpler result.
Grid
I normally exclude the editor grid.
The grid helps me align elements while modelling. However, it usually does not belong in the final diagram.
Copy Inclusion
Options include all pages, current page, or selected elements only.
Embedded Images
If my diagram contains external images, I can embed them in the SVG.
Embedding images makes the SVG more self-contained because it reduces dependencies on separate image files.
However, embedded content can increase the file size.
Embedded Fonts
Font handling deserves attention because another device may not have the same fonts installed.
When the available settings allow it, I consider embedding the required font information. Otherwise, I use common fonts or test the finished SVG in the environment where I plan to publish it.
Links
SVG files can preserve links from diagram elements.
Therefore, I check how links should behave when the exported diagram contains interactive references. This feature matters especially when I publish the SVG on a website or use it in browser-based documentation.
Step 4: Save Your File
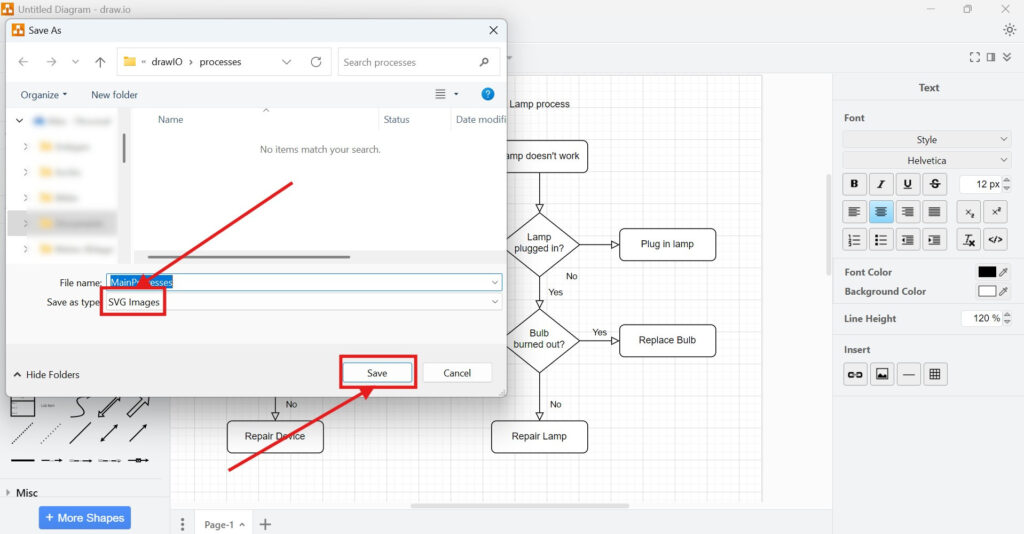
After I configure the settings, I start the export.
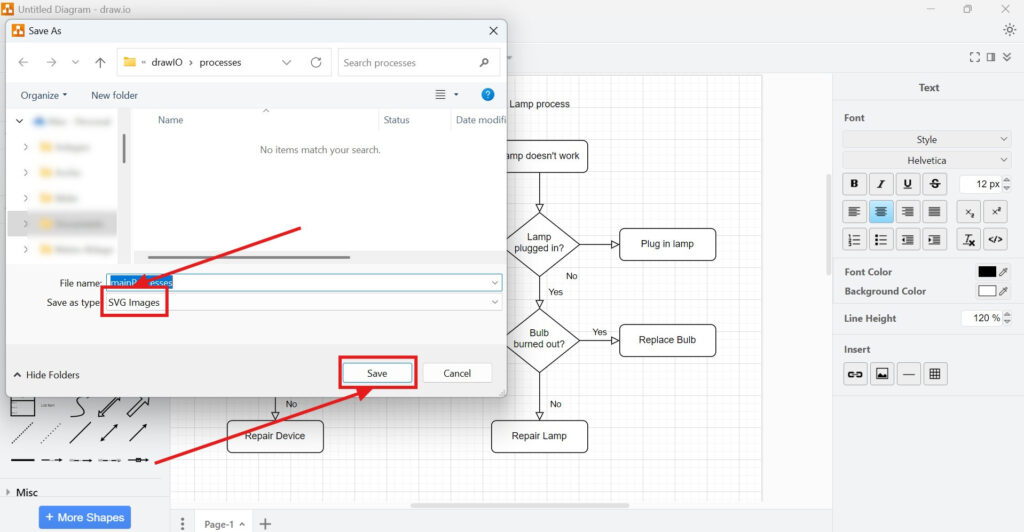
Then, I enter a clear file name and choose the storage location.
For example, I may use:
I keep the same base name as the source diagram whenever possible. Therefore, I can associate the exported SVG with its editable draw.io file easily.
I keep the original draw.io file because the SVG serves mainly as an output format, not as my primary modelling file.
Advanced Export Options
The standard SVG export works well for most situations. However, I use the advanced export settings when I need more control over dimensions or other output properties.
Step 1: Open the Diagram
First, I open the diagram that I want to export.
I check the content and page layout before I continue. This prevents unnecessary corrections after the export.
Step 2: Access Advanced Options
Next, I open File and select Export as.
Then, I choose Advanced.
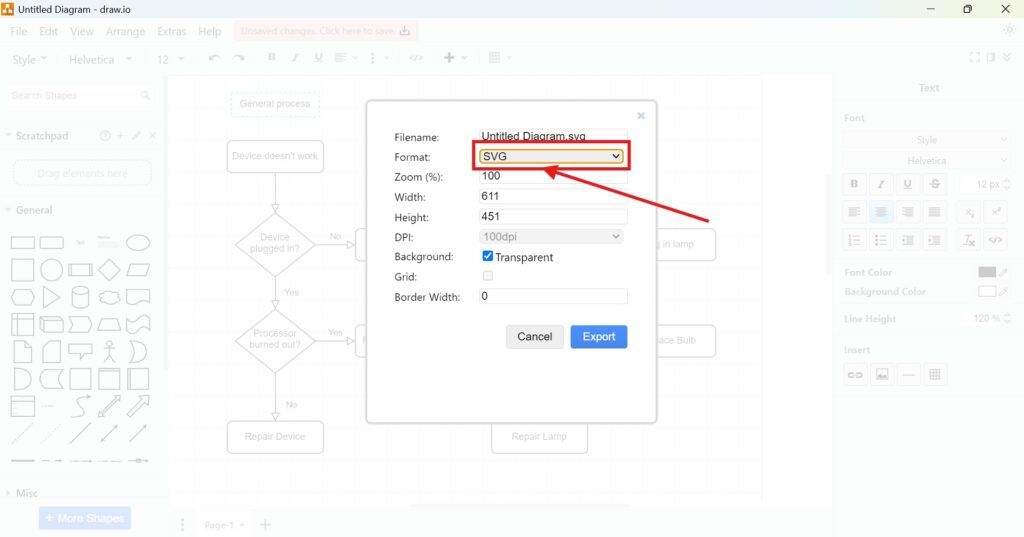
In the advanced export dialog, I select SVG as the output format.
Step 3: Configure Additional Settings
The advanced dialog gives me more direct control over the output.
Filename
First, I enter a clear file name.
I use short and descriptive names so I can identify the SVG later.
Format
I select SVG as the format.
This choice creates a vector graphic rather than a bitmap image.
Zoom
I adjust Zoom when I want to scale the output.
However, I normally define the dimensions directly when exact sizing matters.
Width
Width lets me specify the horizontal size of the export.
This setting helps when I need to fit the graphic into a defined document or website layout.
Height
Height controls the vertical size.
I keep the proportions consistent so the diagram does not appear distorted.
DPI
Some advanced export workflows expose a DPI setting.
DPI matters mainly when an export process involves rasterised content. In contrast, the core SVG shapes remain vector-based and can scale without normal bitmap quality loss.
Background
I choose either a defined background or transparency according to the target environment.
For example, transparency can work well on websites with changing background colours.
Grid
I usually leave the grid disabled.
I include it only when the grid itself communicates useful information.
Border Width
Finally, I set the amount of empty space around the diagram.
A small border often improves readability. However, excessive space can make later placement more difficult.
Step 4: Finalize and Save
After I review the settings, I start the export.
Then, I select the destination and save the SVG.
Finally, I open the exported file and check it. I look at fonts, images, links, spacing, and overall appearance.
A quick check after export helps me detect rendering problems before I publish or distribute the diagram.
Why I Use SVG for draw.io Diagrams
SVG stands for Scalable Vector Graphics.
Unlike a normal bitmap image, an SVG describes many graphic elements mathematically. Therefore, lines, shapes, and text can remain sharp when I enlarge the diagram.
This characteristic makes SVG particularly useful for process models, architecture diagrams, UML diagrams, and other technical graphics.
I often choose SVG when I need:
- sharp diagrams at different sizes,
- graphics for responsive websites,
- high-quality illustrations in documents,
- editable vector content,
- or interactive links.
However, SVG is not always the best format. For example, PNG may provide simpler compatibility when I only need a fixed image.
SVG Versus PNG
I choose SVG when scalability matters.
For example, a website may display the same diagram on a phone, desktop monitor, and high-resolution screen. SVG can adapt without the normal pixelation of a bitmap.
In contrast, I choose PNG when I need a simple image that should look exactly the same in many applications.
SVG works best for scalable diagrams, while PNG often works best for simple fixed-size distribution.
Keep the Source Diagram
I do not treat the exported SVG as a replacement for my original draw.io diagram.
Instead, I keep the editable source file and create SVG files as outputs.
For example:
- order-process.drawio
- order-process.svg
If I change the process later, I update the draw.io source first. Then, I create a new SVG export.
Therefore, I maintain one clear source of truth and avoid editing several independent versions.
Final Thoughts
To export a diagram to SVG in draw.io, I open the diagram, choose File > Export as > SVG, configure the relevant settings, and save the file.
For most diagrams, the standard export dialog provides enough control. However, the advanced export options help when I need specific dimensions or additional output settings.
I also check fonts, embedded images, links, backgrounds, and borders when they matter for the final use.
SVG gives me a scalable and flexible output format that keeps technical diagrams clear across websites, documents, and presentations.
What’s Next?
Now that I know how to export a diagram to SVG in draw.io, I can choose another reliable format for sharing and printing. SVG keeps diagrams scalable, but PDF helps me create stable documents for reviews, reports, and presentations. In the next article, I’ll explain How to Export a Diagram to PDF in draw.io. You’ll learn how PDF export works, when to use it, and how it helps you share diagrams in a professional format. Click below to continue and export your draw.io diagram as a PDF.
Build a Stronger Requirements Workflow with Tools
Requirements engineering becomes clearer when I use tools that support visual thinking, documentation, coordination, and process modeling. Therefore, I use draw.io to create diagrams, Confluence to organize knowledge, Jira to manage requirements-related work, and Camunda to model business processes. Each tool helps me structure a different part of the workflow. As a result, I can connect ideas, decisions, tasks, and processes more effectively. In the main article on Requirements Engineering Tools, I show how these tools work together and help me create better requirements from start to finish.