
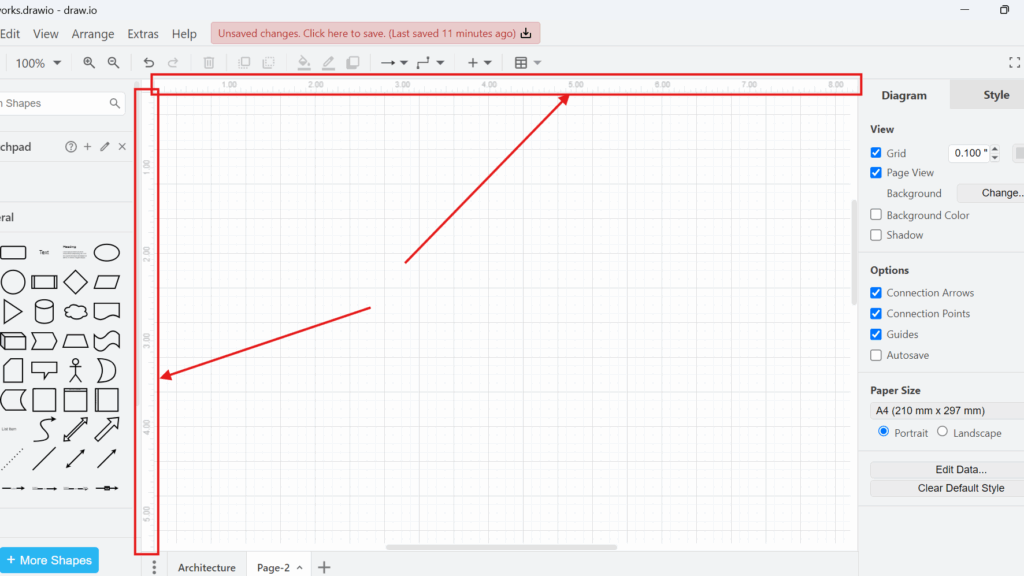
Precise alignment matters in complex diagrams. That is why I use the ruler view in draw.io when I design workflows, network diagrams, or organizational charts. In this article, I explain How to activate and use the ruler view in draw.io. You’ll learn how the ruler helps you control size, distance, and position so your diagrams look cleaner and more professional.
What Is the Ruler View in draw.io?
The ruler view adds two measurement scales to the draw.io editor. One appears horizontally above the canvas. The other appears vertically along its left side.
Together, they give me a permanent reference for the position and dimensions of diagram elements. Therefore, I can estimate distances without relying only on the grid or visual judgment.
The ruler provides a measurement reference; it does not automatically align or move shapes.
This distinction matters. I still use the grid and guides when I want visual alignment support. However, I use the ruler when I want to understand where elements sit within the diagram and how much space separates them.
How to Activate the Ruler View in draw.io
I can enable the ruler directly from the main menu:
- I open my diagram in draw.io.
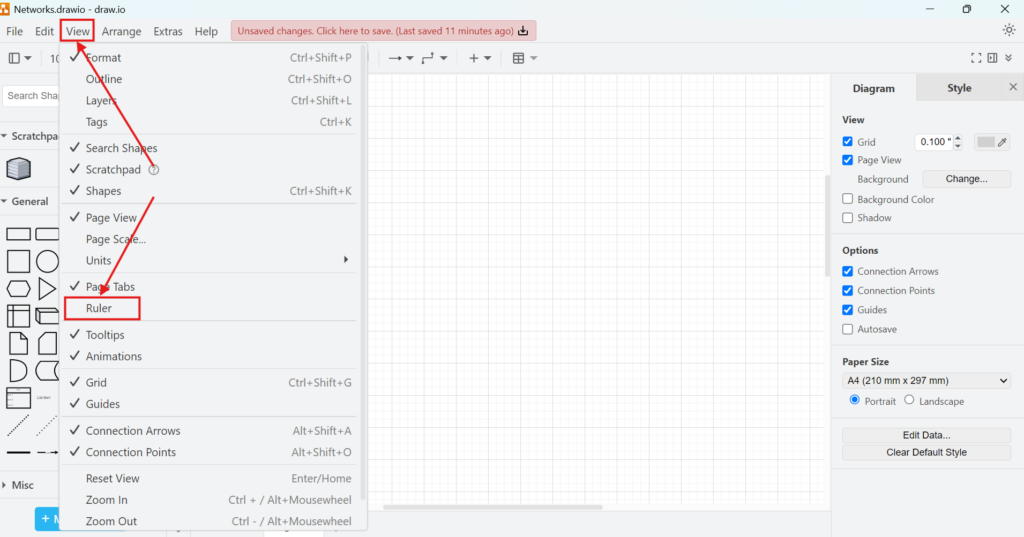
- I select View from the menu bar.
- I click Ruler.
draw.io then adds the horizontal and vertical rulers around the canvas.
How the Ruler Appears
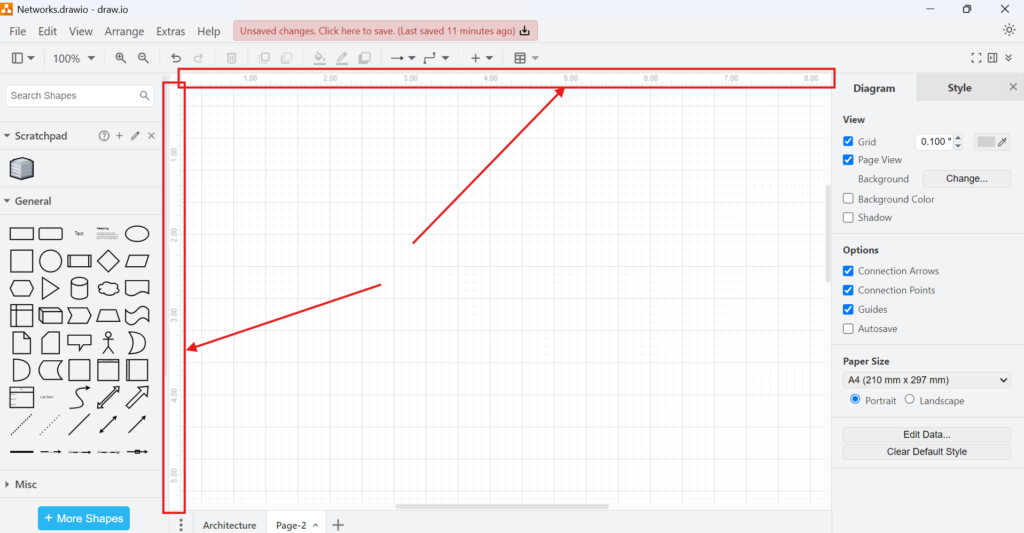
After I activate the feature, I see a horizontal ruler above the drawing area and a vertical ruler on its left side.
The numbered markings provide a coordinate-like reference across the workspace. As a result, I can compare the position of shapes with the same measurement scale in both directions.
How I Use the Ruler in draw.io
I mainly use the ruler for three tasks: positioning, spacing, and checking proportions.
For example, I may create several process steps in one horizontal row. I can use the ruler as a reference when I position the first and last shapes. Then, I can judge whether the entire group uses the available space consistently.
Likewise, I can compare vertical positions when several elements should start at approximately the same height. This becomes particularly useful in large diagrams where small inconsistencies are harder to notice.
The ruler becomes most useful when I need consistent spatial relationships across a larger diagram.
However, I do not treat it as a replacement for the alignment functions in draw.io. If I need exact alignment between several selected shapes, I use the available alignment and distribution commands. The ruler instead helps me understand the overall geometry of the diagram.
Ruler, Grid, and Guides: What Is the Difference?
draw.io provides several features that can look similar at first. However, they solve different problems.
| Feature | Main purpose |
|---|---|
| Ruler | Provides a measurement reference around the canvas |
| Grid | Provides a repeating visual spacing structure |
| Guides | Help me align elements relative to other elements |
| Align and Distribute | Adjust selected shapes into consistent positions |
Therefore, I often combine these features rather than choosing only one.
For example, I can keep the grid visible for general placement, use guides while moving shapes, and keep the ruler active to judge the overall position of a diagram section.
Understanding the Ruler Measurements
The ruler uses the measurement system configured for the diagram. Therefore, its markings depend on the units I use in draw.io.
I can review or change these units through View > Units.
This becomes useful when I prepare diagrams for printing, documentation, or layouts where physical dimensions matter. In contrast, the exact unit often matters less when I create a purely digital diagram. In that situation, I can still use the ruler as a consistent spatial reference.
The main value of the ruler is consistency, not the unit itself.
When I Find the Ruler Most Useful
I normally activate the ruler when the diagram has a deliberate visual structure. Typical examples include process diagrams, architecture diagrams, network diagrams, organizational charts, and other layouts with repeated elements.
It also helps when I want to maintain consistent margins around a diagram or compare the width of different sections.
However, I do not always need it. For a small flowchart with only a few shapes, the grid and guides often provide enough support. Therefore, I enable the ruler when the additional measurement reference actually improves my control over the layout.
How to Hide the Ruler Again
I can remove the rulers with the same command:
View > Ruler
The setting works as a toggle. Therefore, selecting it again hides the horizontal and vertical rulers without changing the diagram itself.
Final Thoughts
The ruler view in draw.io is a small feature, but it becomes valuable when I care about spatial consistency. It gives me a stable reference for position, distance, and overall layout.
I use the ruler for measurement and orientation, while I use grids, guides, and alignment tools for precise arrangement.
That combination gives me better control without adding unnecessary complexity to the diagramming process.
What’s Next?
Now that I know how to activate and use the ruler view in draw.io, I can place elements with more precision. However, I also need to move between details and the bigger picture. That is where zoom becomes useful. In the next article, I’ll explain How to Zoom in and Zoom out in draw.io. You’ll learn how zoom helps you inspect details, review layouts, and navigate diagrams more comfortably. Click below to continue and control your draw.io view with more confidence.
Use Tools That Bring Requirements into Focus
Requirements engineering becomes clearer when I use tools that support visual thinking, documentation, coordination, and process modeling. Therefore, I use draw.io to create diagrams, Confluence to structure knowledge, Jira to manage requirements-related work, and Camunda to model business processes. Each tool helps me handle a different part of the workflow. As a result, I can connect ideas, decisions, tasks, and processes more effectively. In the main article on Requirements Engineering Tools, I show how these tools work together and help me build a stronger requirements engineering process.
| Read mora about draw.io |
|---|
| Import PNG Export JPEG Export WebP Export SVG Export |