
When I work with complex systems, I need clarity and structure. Therefore, I use requirements modeling to express information in a clear way. I want to understand what the system must deliver and communicate this to all stakeholders. Because of this, I always choose the right modeling language with care. Although many diagram types exist, I begin with one guiding question: what is my purpose?
I Start with the Purpose of the Model
Requirements models reduce complexity. However, they only help when I use the right form of modeling for the problem.
For example, I may need to understand:
- system context and boundaries
- processes and responsibilities
- data structures
- system behavior
- events and reactions
- hardware and software interactions
- dynamic behavior
- requirements and their relationships
These questions require different models.
I do not choose a modeling language because it is popular. I choose it because its concepts match the information I need to express.
Therefore, I first define the purpose. Then I select the notation.
I Separate the Domain from the Modeling Language
I also make an important distinction. Banking, industrial automation, information systems, and embedded systems are domains or system types. BPMN, UML, SysML, EPC, and entity-relationship modeling are modeling approaches or languages.
This distinction matters because one domain can require several modeling languages.
For example, a banking system may need BPMN for payment processes, an entity-relationship model for data, UML for application behavior, and architecture diagrams for system integration.
A complex system rarely has one correct modeling language. It usually needs several complementary views.
Information Systems: I Model Purpose, Information, People, and Technology
For an information system, I often begin with a high-level conceptual view. I want to understand how users, information, processes, and technology work together.
Such a model helps me establish context before I describe detailed requirements. It can also reveal missing actors, information flows, or system responsibilities.
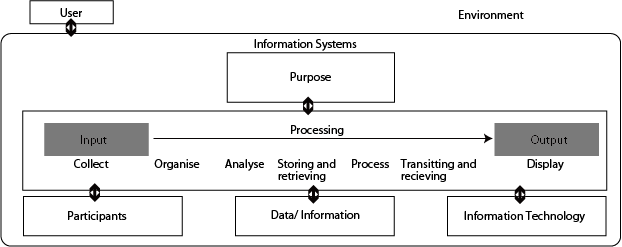
This type of diagram is useful during early analysis. However, I normally complement it with more precise models later.
Embedded Systems: I Model Software and Hardware Together
Embedded systems require another perspective. Here, software behavior depends directly on hardware, operating-system services, timing, memory, communication, and physical interfaces.
Therefore, I need models that preserve these relationships.
I may use architecture diagrams for the overall structure. In addition, I can use UML state machines for behavior or SysML for multidisciplinary system relationships.
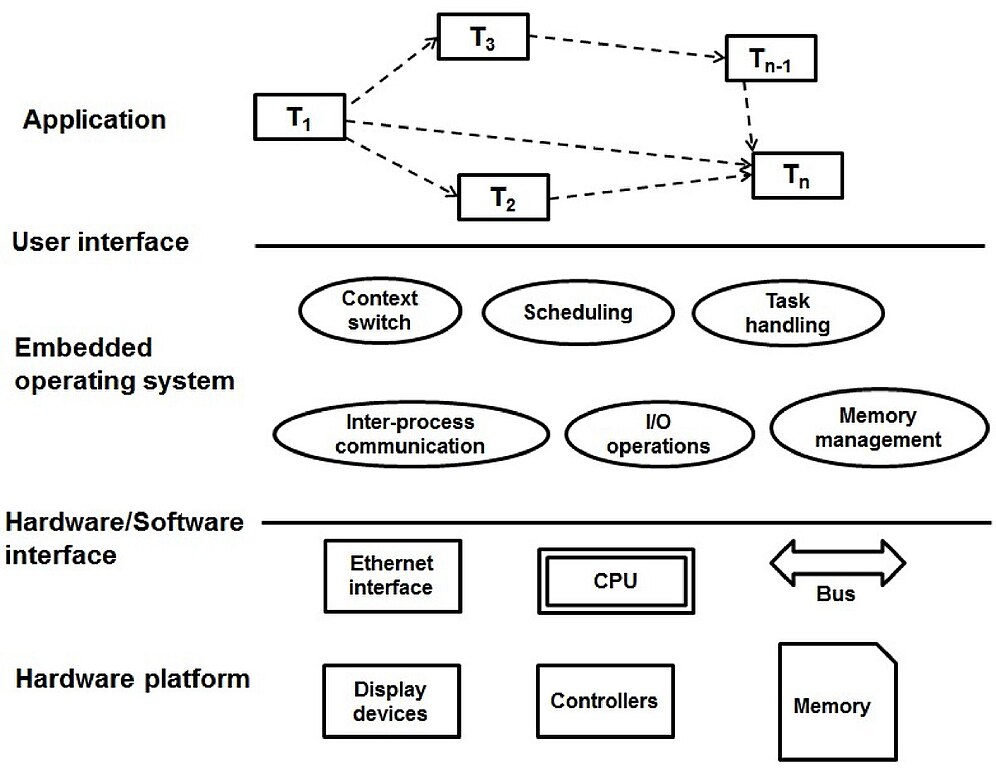
For embedded systems, I cannot analyze software requirements independently from the technical environment in which the software operates.
Banking Systems: I Combine Process, Stakeholder, and System Views
Banking is a domain rather than a modeling language. Nevertheless, it illustrates why I often need several models.
I may need to describe business processes, system responsibilities, controls, interfaces, data, and organizational involvement. Moreover, regulated systems require clear traceability between requirements and their sources.
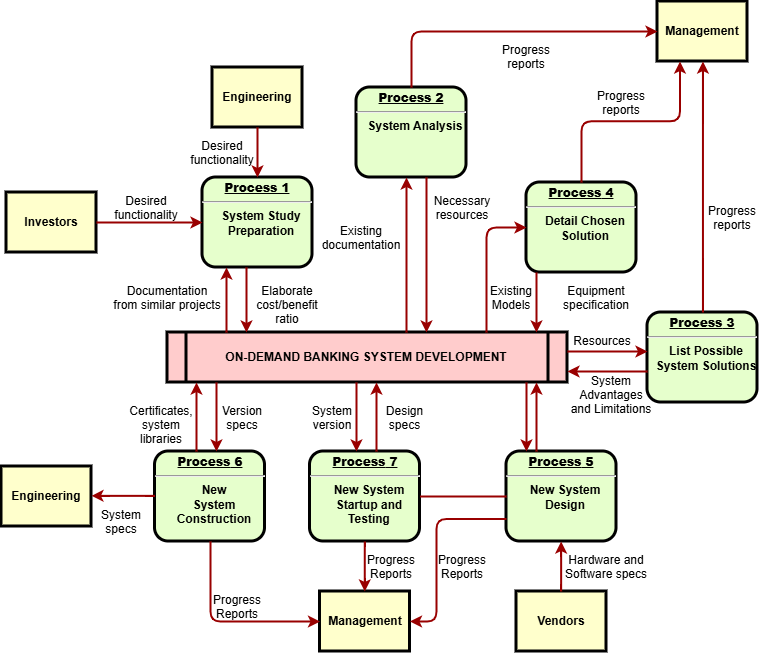
For process details, I usually prefer BPMN. For data, I can use entity-relationship modeling. For system structure, UML, SysML, or architecture views may be more suitable.
Industrial Systems: I Model Material, Information, and Responsibility Flows
Industrial systems often connect suppliers, production, logistics, distributors, customers, software, and physical equipment.
Therefore, I first decide which flow matters.
For example, I may model material movement, information exchange, control signals, or organizational responsibilities.
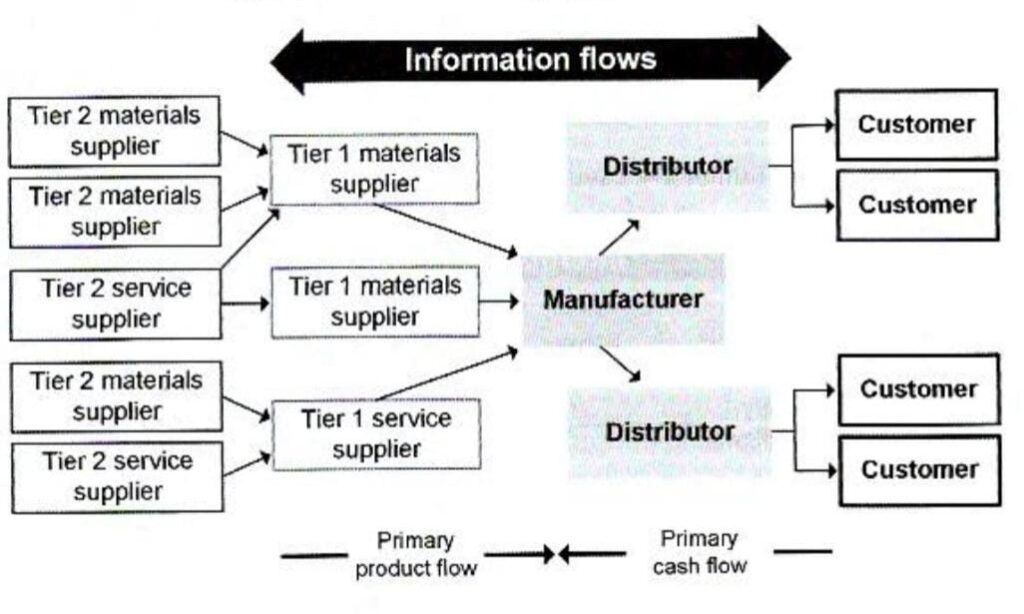
This model provides a useful overview. However, if I need executable process semantics, I move to BPMN or another formal process notation.
Automation: I Model Triggers, Rules, Conditions, and Actions
Automation requirements often follow a simple logic:
An event occurs. The system evaluates information. Then it performs an action.
Therefore, workflow models work well when I need to explain automated sequences.
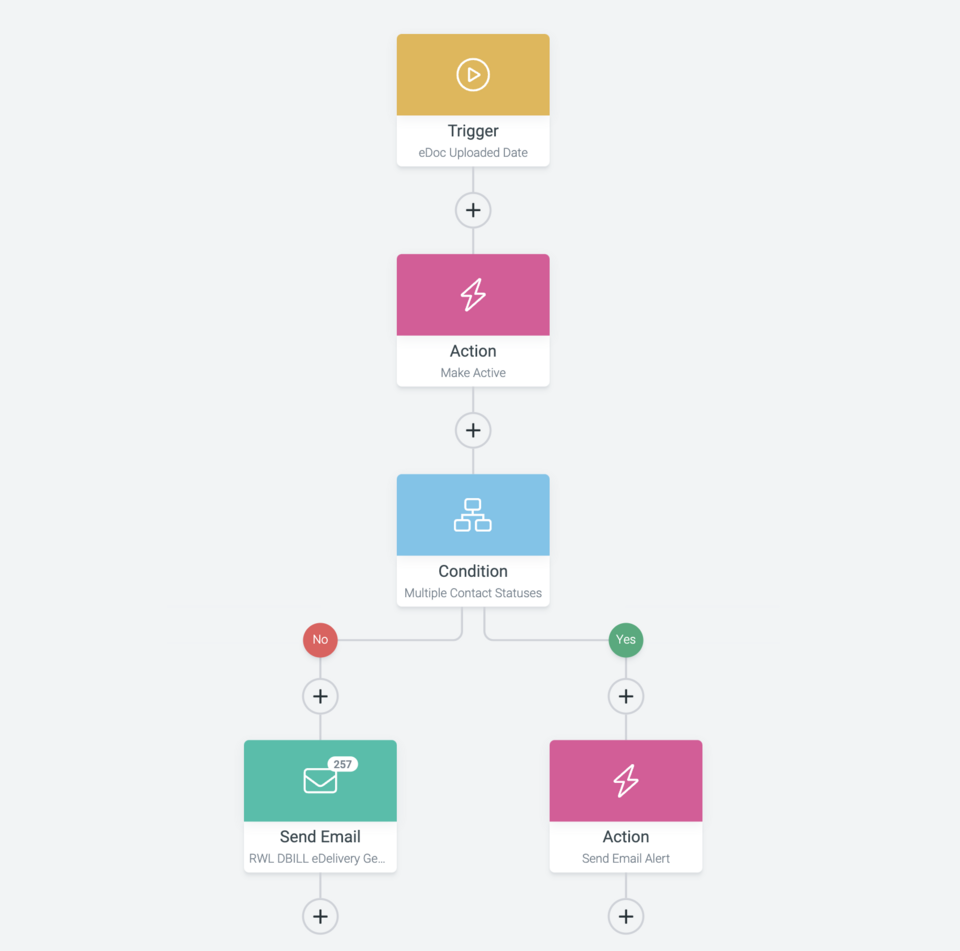
Such diagrams work especially well with business stakeholders because they make rule-based behavior easy to follow.
However, I use more formal models when timing, concurrency, exception handling, or complex state behavior becomes important.
Distributed and IoT Systems: I Use Architecture Views
Distributed systems introduce another challenge. Components operate across devices, networks, cloud services, data stores, applications, and enterprise systems.
A simple process model cannot represent all of these concerns clearly.
Therefore, I use architecture views to show components and connections.
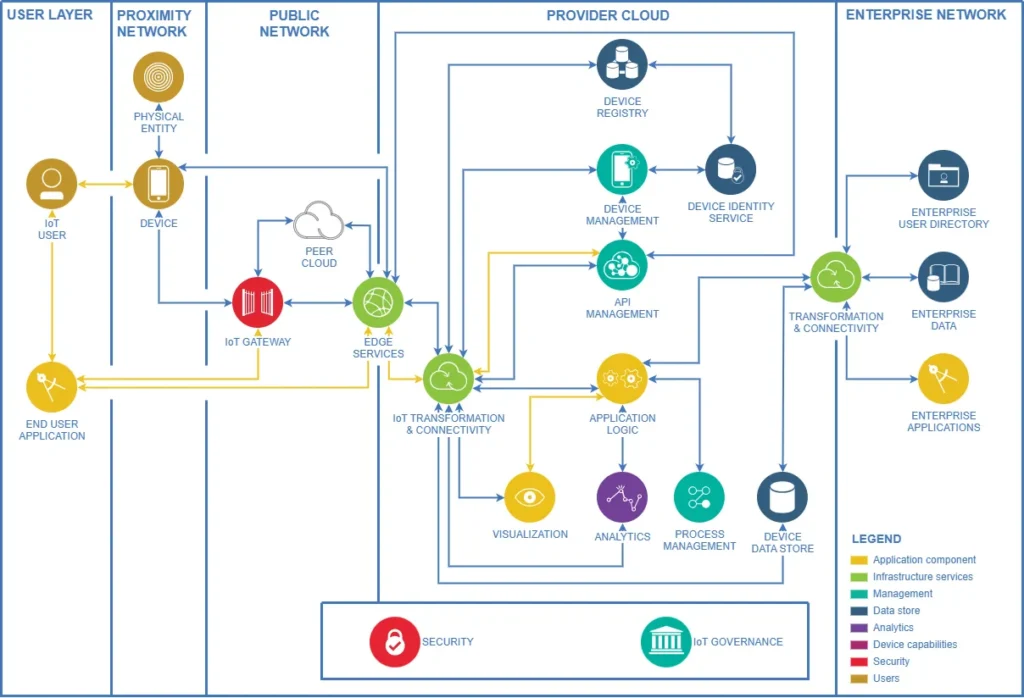
This view helps me identify interfaces and dependencies. Consequently, I can derive more precise interface, security, availability, and data requirements.
Data Requirements: I Use Entity-Relationship Models
When the main question concerns information structure, I use a data model.
An entity-relationship diagram helps me identify entities, attributes, identifiers, and relationships. Therefore, it works well for conceptual and logical data analysis.
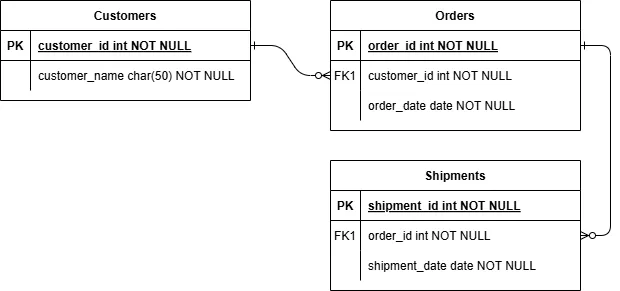
For example, this model immediately shows that customers can relate to orders and that shipments refer to orders.
A data model explains what information exists and how it relates. It does not explain how a process executes.
That distinction prevents me from using one diagram for two different purposes.
Business Processes: I Use BPMN
When I need to describe process behavior, BPMN is often my first choice.
BPMN gives me explicit concepts for activities, events, gateways, subprocesses, message interactions, and sequence flows. Therefore, I can represent much more than a simple flowchart.
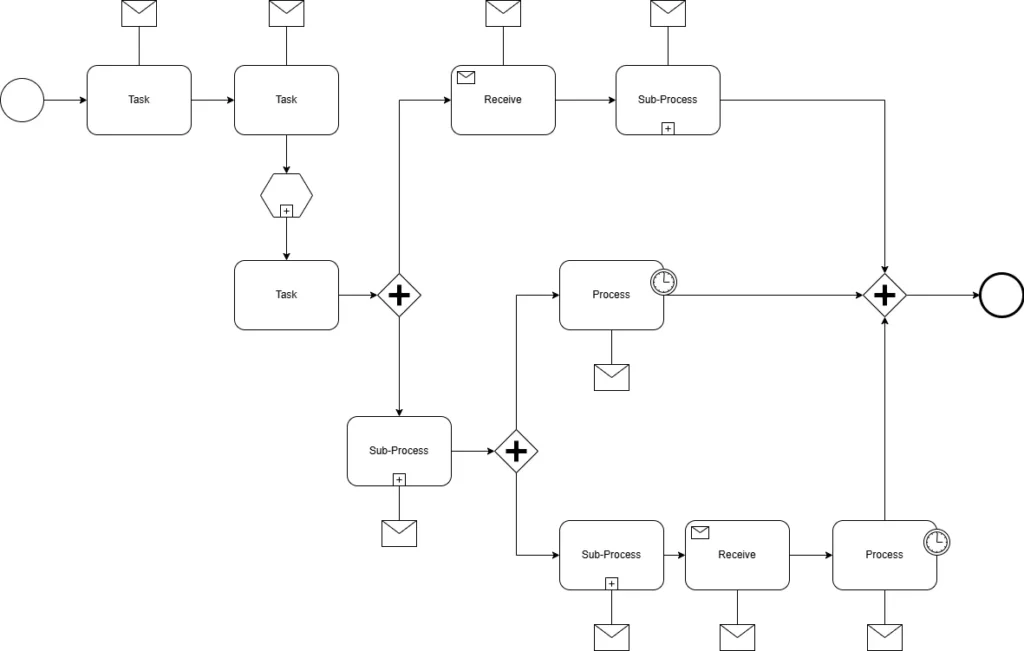
I use BPMN when requirements depend on who performs an activity, what happens next, which alternatives exist, or how the process reacts to events.
However, I keep diagrams as simple as the analysis permits. More BPMN elements do not automatically create a better requirements model.
Process Chains: I Can Use EPC for Event-Function Logic
For high-level business processes, I may also encounter Event-driven Process Chains.
EPC separates states from activities. Events describe what has happened or what condition exists. Functions describe what happens next. Connectors control alternative or parallel paths.
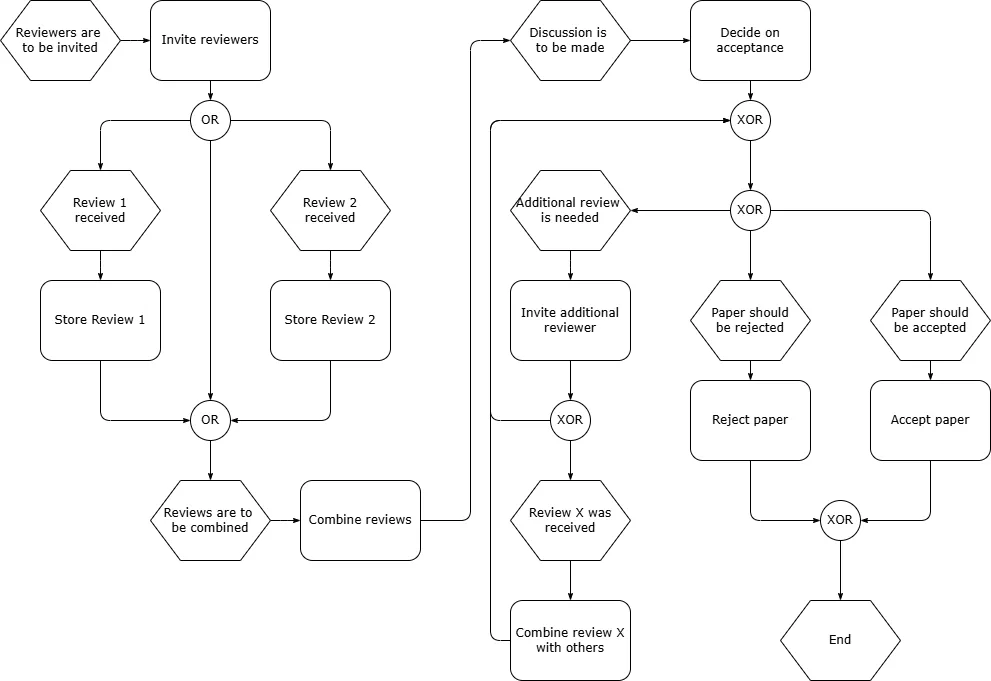
EPC remains useful in environments where this notation already forms part of the established process landscape.
Nevertheless, I usually prefer BPMN when I need richer process semantics or close alignment with workflow automation.
Event and Data Flows: I Use Architecture Models When Process Models Are Not Enough
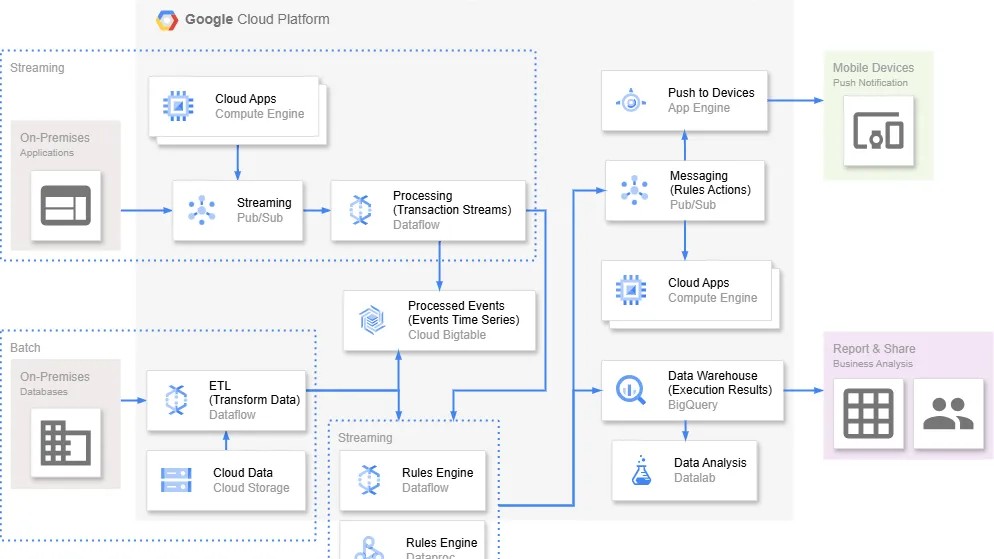
Event-driven architectures can contain producers, messaging services, processing components, data stores, applications, and consumers.
In such cases, I want to understand where information originates, how the system processes it, where it persists, and which components consume it.
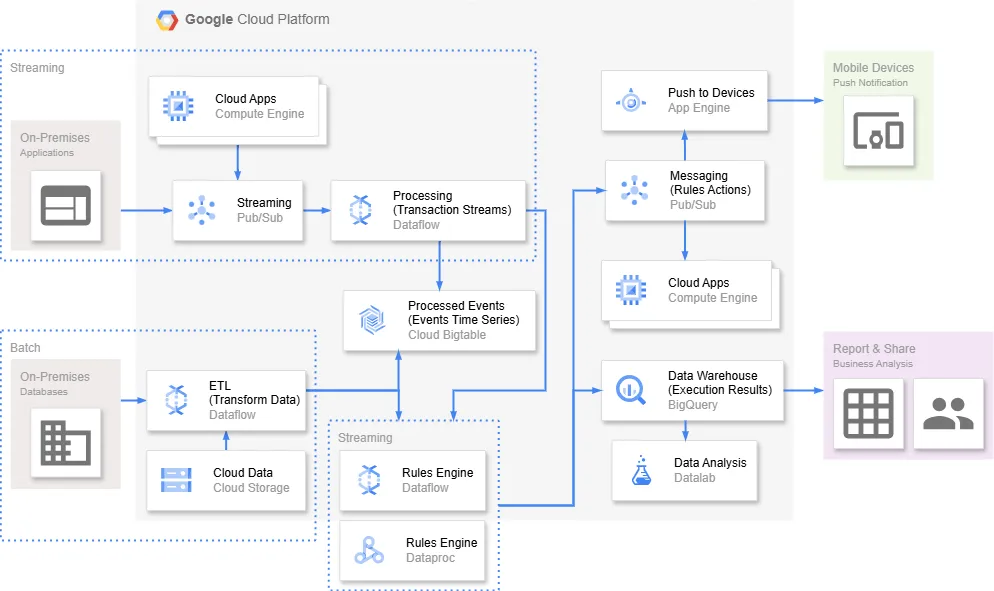
This is an architecture model rather than a process model. The distinction matters.
A BPMN model could describe the business process that uses these services. However, the architecture view shows the technical components that enable that process.
Dynamic Systems: I Use Mathematical and Simulation Models
Some requirements concern continuous behavior rather than discrete business activities.
For example, control systems may depend on physical variables, feedback loops, mathematical functions, and values that change over time.
Here, tools such as MATLAB and Simulink provide a more suitable modeling approach.
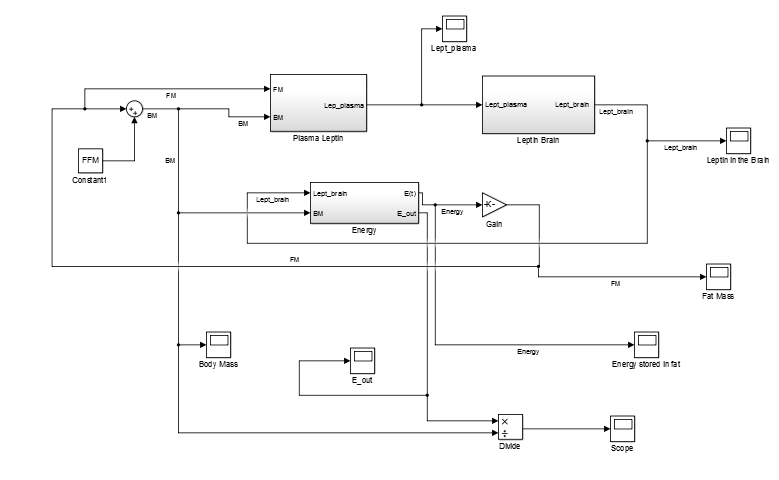
Such models allow engineers to explore system behavior quantitatively. Therefore, they can support requirements for control functions, thresholds, response times, and system performance.
UML: I Use the Diagram That Matches the Question
UML is not one diagram. It is a family of diagrams for software structure and behavior.
For example, I can use class diagrams for structural relationships, sequence diagrams for interactions, state machines for state-dependent behavior, and activity diagrams for workflows.
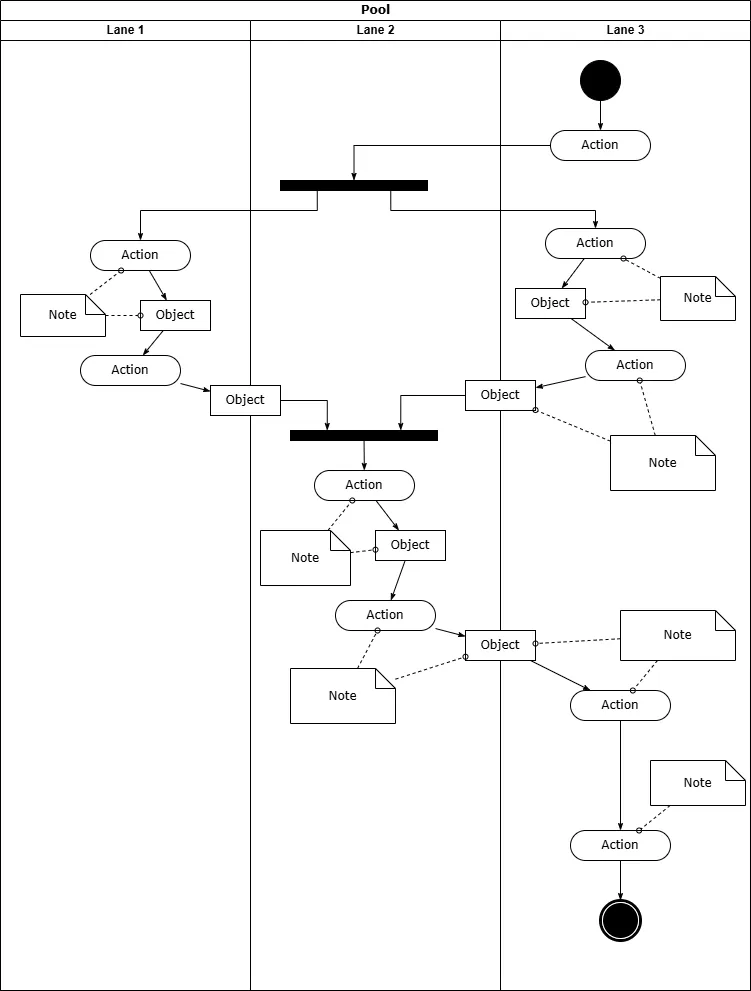
Therefore, saying that I use UML is not yet precise enough. I also need to identify the UML diagram type.
I select the UML diagram according to the question I want the model to answer.
SysML: I Use It for Integrated Systems Engineering
SysML extends modeling beyond software. I use it when requirements span hardware, software, people, physical components, and other engineering disciplines.
One particularly useful feature is explicit requirements modeling.
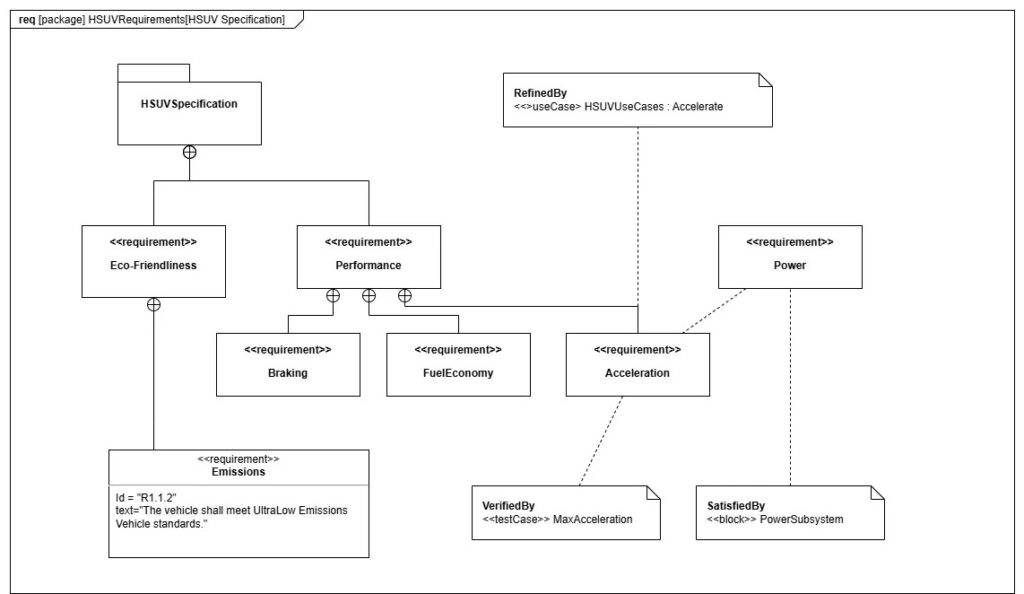
A SysML requirements diagram can show how requirements relate to each other. In addition, it can connect requirements to design elements, test cases, and other model elements.
Consequently, SysML becomes especially valuable when traceability matters across a large engineering lifecycle.
How I Make the Final Choice
I reduce the decision to four questions.
First, I ask what information I need to understand. A process, data structure, interaction, architecture, state, or requirement hierarchy each points toward a different model.
Second, I consider the system. An enterprise application requires different views from an embedded controller or a multidisciplinary engineered product.
Third, I consider the audience. Business stakeholders need understandable models. Developers and engineers may require more formal detail.
Finally, I consider what happens after the analysis. A diagram for discussion has different requirements from a model used for simulation, code generation, workflow execution, or formal traceability.
The best modeling language is the one that makes the required information clearer without introducing unnecessary complexity.
Conclusion
I treat requirements modeling as a means of answering questions, not as an exercise in creating diagrams.
Therefore, I start with the purpose. Then I identify the information that matters. Only after that do I choose BPMN, UML, SysML, EPC, entity-relationship modeling, architecture modeling, Simulink, or another suitable approach.
This also means that I do not force an entire system into one notation. I combine models when different perspectives require them.
A good requirements model makes complexity easier to understand, exposes missing information, and creates a shared basis for decisions.
That is the standard I use when I choose a modeling language for requirements engineering.
Credits: Taken from Wikimedia Commons: Information System Image by John Yeung (Deed – Attribution-ShareAlike 3.0 Unported – Creative Commons) | Embedded System Image by Bassem Ouni, Cécile Belleudy, Eric Senn (Deed – Attribution 2.0 Generic – Creative Commons) | Industrial Applications Image by APICS (Deed – Attribution 4.0 International – Creative Commons) | Automation Image by PathwayPort (Deed – CC0 1.0 Universal – Creative Commons) | Simulink Image by Jorge Guerra Pires (Deed – Attribution-ShareAlike 4.0 International – Creative Commons) | I created all the other images with draw.io.
This article covers concepts that are also included in the CPRE certification syllabus.