
Accurate diagrams need the right measurement units. When I first used draw.io, I struggled to find the setting. Therefore, this guide explains how to change the grid units in draw.io in a simple way. You’ll learn where to adjust the units, why they matter, and how they help you place diagram elements more precisely.
What Are Grid Units in draw.io?
Grid units define the measurement system that draw.io uses for relevant dimensions and grid values.
I can choose between:
- Points
- Inches
- Millimeters
- Meters
For example, I may use millimeters when I prepare a diagram for metric documentation. In contrast, inches make more sense when I work with imperial measurements. Points work well for ordinary diagrams where physical dimensions are less important. Finally, meters can help with larger physical layouts.
Changing the unit changes how draw.io expresses measurements. It does not automatically resize the objects in my diagram.
This distinction matters. Units, grid spacing, and diagram scale are related settings, but they do different things.
How to Change the Grid Units in draw.io
I can change the unit directly from the main menu.
First, I open View. Then, I move to Units. Draw.io opens a submenu with the available measurement systems. Finally, I select the unit I want.
In the example below, I select Inches.
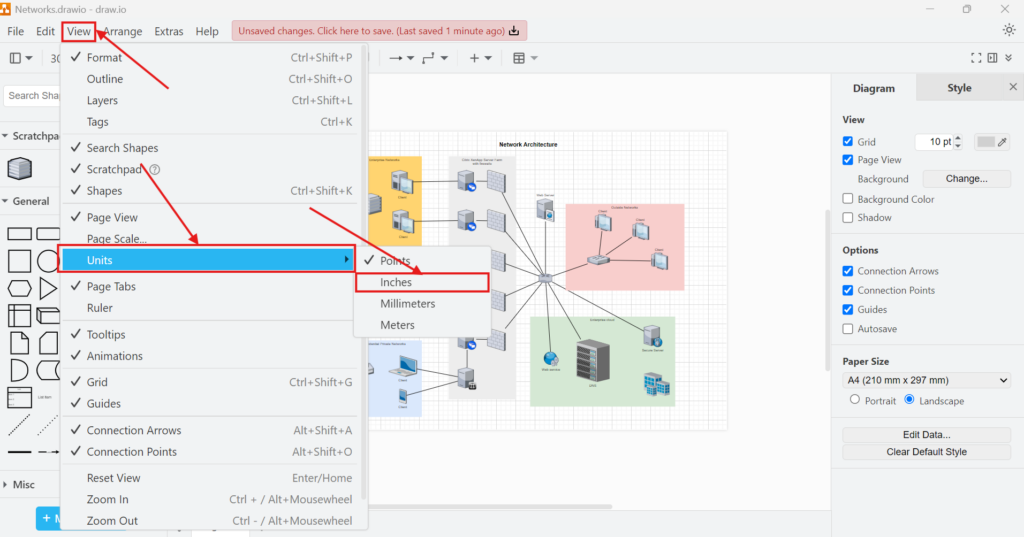
After I select the unit, draw.io applies it immediately. Therefore, I do not need to confirm the change in another dialog.
The complete path is View → Units → the required measurement unit.
How to Check the Selected Unit
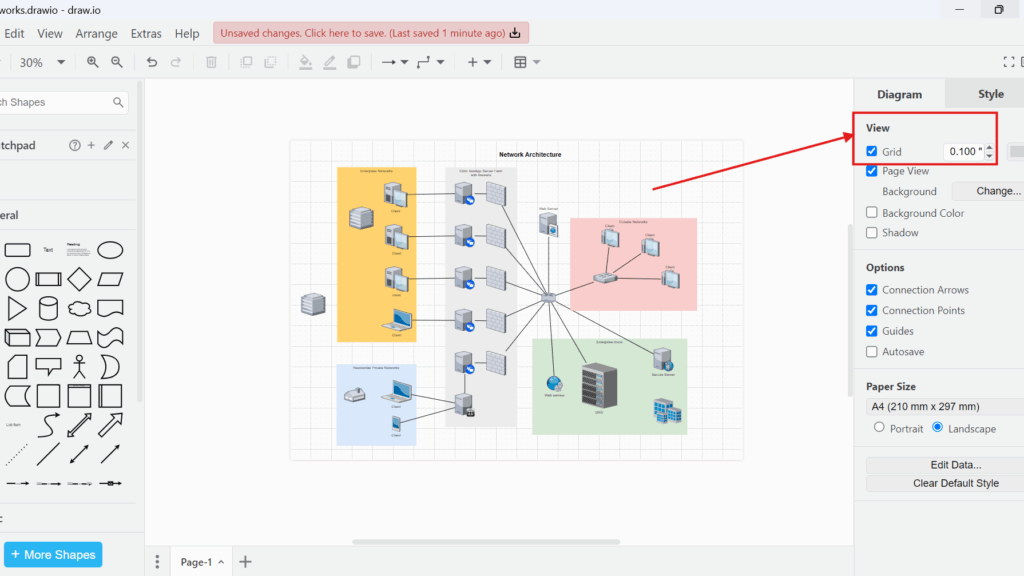
After changing the unit, I check the Diagram panel on the right.
The Grid setting provides a simple visual confirmation. In my example, I selected inches. Therefore, draw.io displays the grid spacing as 0.100″.
This makes the effect of the change easier to see.

If I choose another unit, draw.io expresses the relevant value using that measurement system instead.
Grid Units, Grid Spacing, and Page Scale Are Different
I keep these three settings separate because they solve different problems.
The unit determines how draw.io expresses measurements. The Grid value determines the spacing of the grid. In addition, the Grid checkbox controls whether I see the grid on the canvas.
Changing the measurement unit is not the same as changing the grid spacing or the page scale.
For example, switching from points to inches does not simply make my diagram larger. Instead, it gives me another way to work with and interpret dimensional values.
This is especially important when I prepare diagrams for printing or when I need dimensions that correspond to an external specification.
Which Unit Should I Use?
I choose the unit according to the purpose of the diagram.
For general flowcharts, process models, UML diagrams, and similar visual models, points are often sufficient. However, I use millimeters when I need metric measurements. Likewise, I use inches when the surrounding documentation follows the imperial system. For larger physical layouts, meters can be more convenient.
However, I do not treat draw.io as a CAD application. If exact engineering dimensions or tolerances determine whether something can be manufactured or installed, I use a tool designed for that purpose.
For most diagrams, consistency matters more than the specific unit I choose.
Final Thoughts
Changing the grid units in draw.io takes only a few seconds. I open View → Units, select Points, Inches, Millimeters, or Meters, and then check the Grid field if I want to verify the result.
The setting becomes particularly useful when I work with printed diagrams, physical layouts, or documentation that follows a defined measurement system. At the same time, I keep units separate from grid spacing and page scale. That distinction helps me control diagram measurements without changing settings that serve a different purpose.
What’s Next?
Now that I know how to change the grid units in draw.io, I can work with more precision. However, editing also means making changes, testing ideas, and correcting mistakes. In the next article, I’ll explain How to Undo or Redo Editing in draw.io. You’ll learn how to reverse changes, restore actions, and keep your diagram workflow under control. Click below to continue and edit your draw.io diagrams with more confidence.
Improve Requirements Engineering with Practical Tools
Requirements engineering becomes clearer when I use tools that support visual thinking, documentation, task management, and process modeling. Therefore, I use draw.io to create diagrams, Confluence to structure knowledge, Jira to track work, and Camunda to model business processes. Each tool helps me handle complexity in a different way. As a result, I can explain ideas, document decisions, manage progress, and improve collaboration with stakeholders. In the main article on Requirements Engineering Tools, I show how these tools work together and support a stronger requirements workflow.