
Embedding a draw.io diagram into a website may seem tricky at first. However, it is easier than it looks. In this article, I explain How to embed a draw.io diagram with an HTML tag. You’ll learn the basic workflow, see why the method is useful, and understand how it helps you show diagrams clearly on a web page.
If you would prefer to watch the content as a video, click here:
What is draw.io?
draw.io (opens in new tab), now part of diagrams.net, is a fantastic tool for creating diagrams. It’s intuitive, flexible, and completely free. I use it for flowcharts, network diagrams, and even quick mockups. One of its standout features is the ability to export diagrams as different file types. For example, you can save your work as an image, a PDF, or even a scalable vector graphic (SVG) file.
But why SVG? An SVG file keeps your diagram crisp and clear at any zoom level. It’s perfect for embedding into a website because it’s lightweight and scales beautifully. Plus, it’s easy to use with HTML—which brings us to our next point.
How to Embed a draw.io <svg> Image Tag
How to Embed a draw.io <svg> Image Tag is useful when I want to place a scalable diagram directly inside a web page. Draw.io can generate the SVG markup for me through its Embed function. I can then copy the code into a website, documentation page, or HTML file. In this guide, I show the complete process step by step. I also explain the relevant options for fitting, shadows, image handling, lightbox behaviour, editing, and layers, so I can configure the embedded diagram for its intended use too.
What Is an HTML <svg> Tag?
An HTML <svg> tag places vector graphics directly inside a web page.
SVG uses XML-based instructions for shapes, lines, text, and other graphic elements. Therefore, browsers can scale the graphic without the normal pixelation of bitmap images such as PNG or JPEG.
This makes SVG useful for process models, UML diagrams, architecture diagrams, and other graphics with fine lines and text.
SVG remains sharp at different display sizes because it uses vector graphics instead of fixed pixels.
Because the SVG becomes part of the HTML, web developers can also control or modify its appearance when necessary.
Step-by-Step Guide to Embedding with <svg>
First, I open the diagram that I want to embed in draw.io.
Then, I follow these steps.
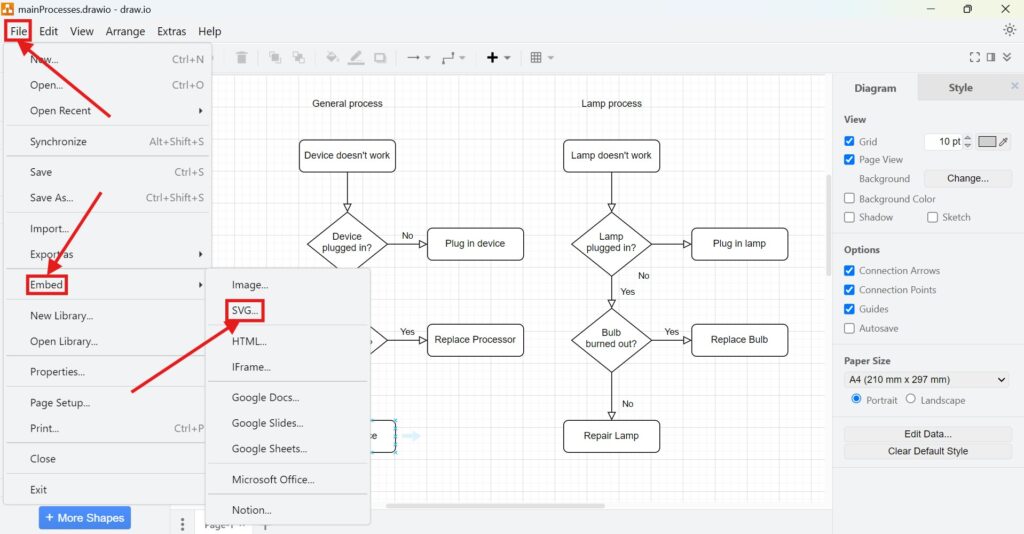
Step 1: Select File > Embed > SVG
I open File and select Embed.
Next, I choose SVG.
Draw.io opens the available embedding options.
I use this function when I want draw.io to generate SVG markup for direct use inside HTML content.
Step 2: Select Your Preferred Configuration
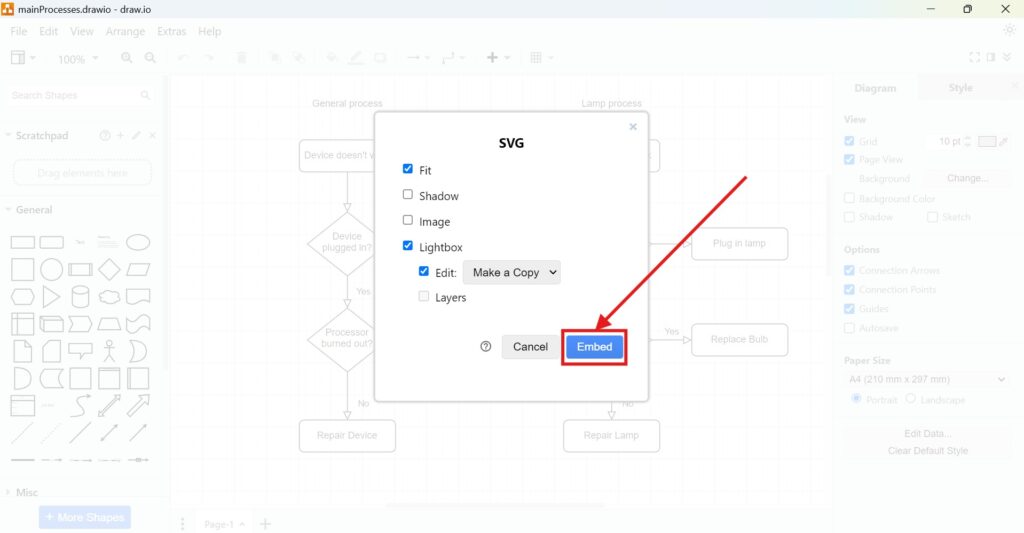
Next, I configure how the embedded diagram should appear and behave.
Fit
Fit adjusts the diagram to the available display area.
Therefore, I use it when the SVG should adapt to the available space on the web page.
Shadow
Shadow includes the visual shadow effects from the diagram.
I enable it only when those effects support the intended design.
Image
The Image option controls how draw.io handles image content within the generated SVG.
I review this option when my diagram contains images because it can affect how self-contained the final embed becomes.
Lightbox
Lightbox lets viewers open the diagram in a larger and more focused view.
I use it for complex diagrams or models with small labels.
Lightbox Edit
Editing options can let viewers reuse or modify the diagram.
For example, Make a Copy can provide an editable copy without changing my original.
Lightbox Layers
If the diagram contains layers, this option can let viewers show or hide them.
Therefore, one embedded diagram can provide different levels of information.
I enable only the options that support the intended viewing or editing experience.
After I configure the settings, I click Embed.
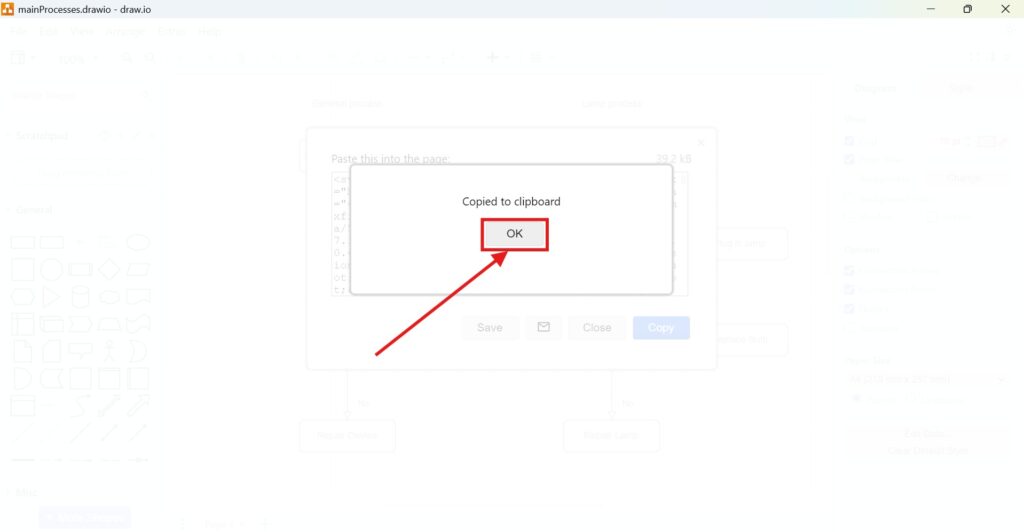
Step 3: Copy the Code
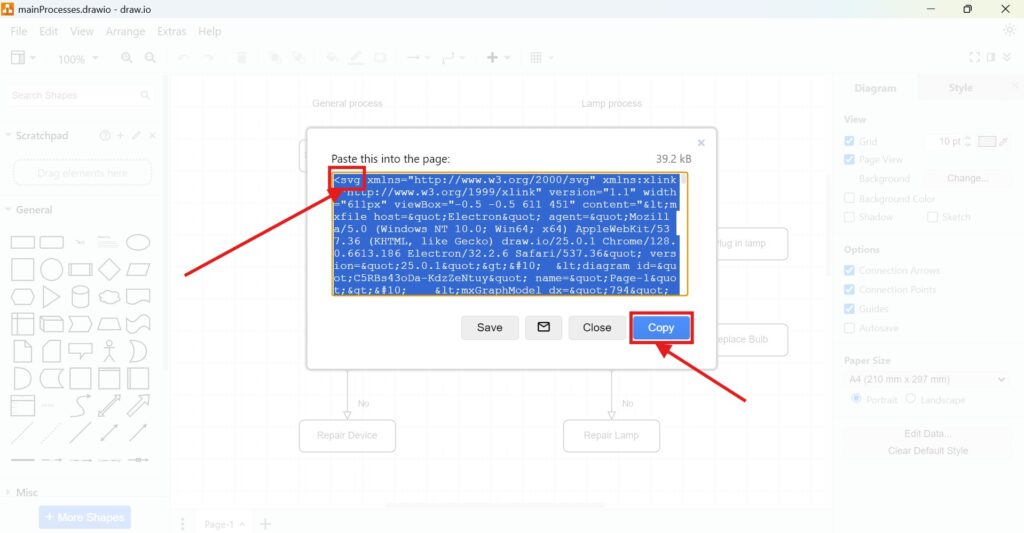
Draw.io now generates the required SVG and HTML code.
I click Copy to place the generated content on my clipboard.
I keep the original draw.io file as my editable source. Therefore, I treat the generated code as publication output.
Keeping the original diagram separate makes later updates easier and reduces version conflicts.
Step 4: Use the Code Where I Need It
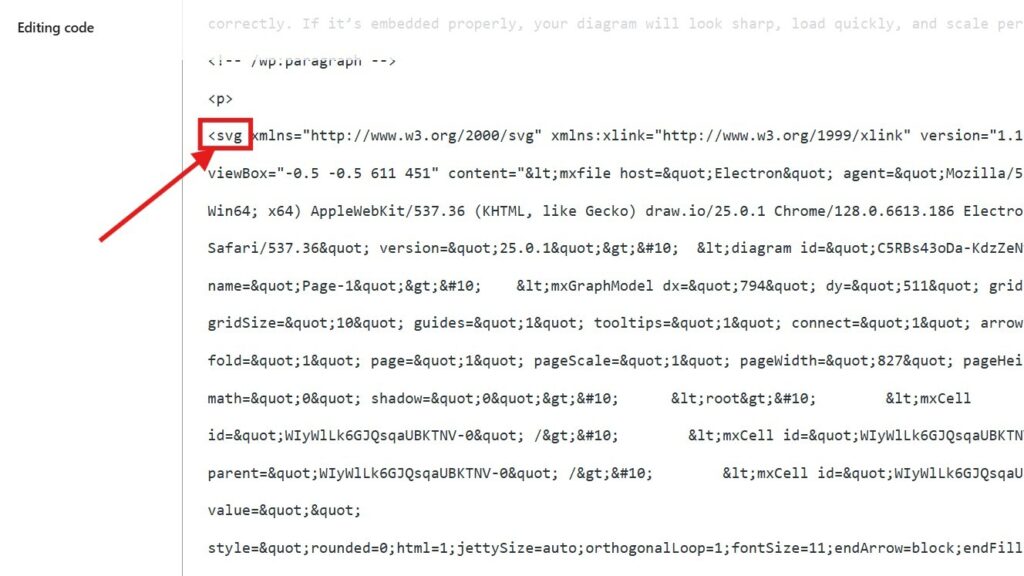
Finally, I paste the generated code into an HTML environment that accepts SVG markup.
For example, I can use it in a website, technical documentation, an internal knowledge base, or another HTML document.
If I use WordPress or another content management system, I choose an editor or block that accepts HTML.
Then, I preview the result.
I check the size, text readability, links, lightbox behaviour, layers, and mobile display. If necessary, I return to draw.io, change the settings, and generate the code again.
I always test the embedded SVG in its final environment before I publish it.
[Image placeholder: Embedded SVG displayed on the web page]
Why I Use SVG for Web Diagrams
I use SVG when scalability and clear text matter.
For example, the same diagram may appear on a phone, laptop, or large monitor. SVG can adapt to these sizes while keeping vector elements sharp.
Moreover, SVG integrates directly with HTML. Therefore, it provides more flexibility than a simple bitmap image.
However, I use PNG when I only need a fixed image. I may also use the draw.io image embed when I want a simpler image-based approach.
Final Thoughts
To embed a draw.io diagram with an <svg> tag, I select File > Embed > SVG, configure the relevant options, generate the code, copy it, and paste it into my HTML content.
The main settings control fitting, shadows, image handling, lightbox behaviour, editing, and layers.
A well-configured SVG embed gives me a scalable and flexible way to display draw.io diagrams directly inside web pages.
What’s Next?
Now that I know how to embed a draw.io diagram with an HTML tag, I can explore a broader embedding method. An image tag is simple and useful, but HTML can give me more flexibility when I publish diagrams online. In the next article, I’ll explain How to Embed a Draw.io Diagram with HTML. You’ll learn how HTML embedding works and how it helps you present diagrams more clearly on a web page. Click below to continue and embed your draw.io diagram with HTML.
Explore Requirements Engineering Tools in Practice
Requirements engineering becomes clearer when I use tools that support visual thinking, documentation, coordination, and process modeling. Therefore, I use draw.io to create diagrams, Confluence to structure knowledge, Jira to manage requirements-related work, and Camunda to model business processes. Each tool helps me handle complexity from a different angle. As a result, I can connect ideas, decisions, tasks, and workflows more effectively. In the main article on Requirements Engineering Tools, I show how these tools work together and help me build a stronger requirements engineering workflow.