
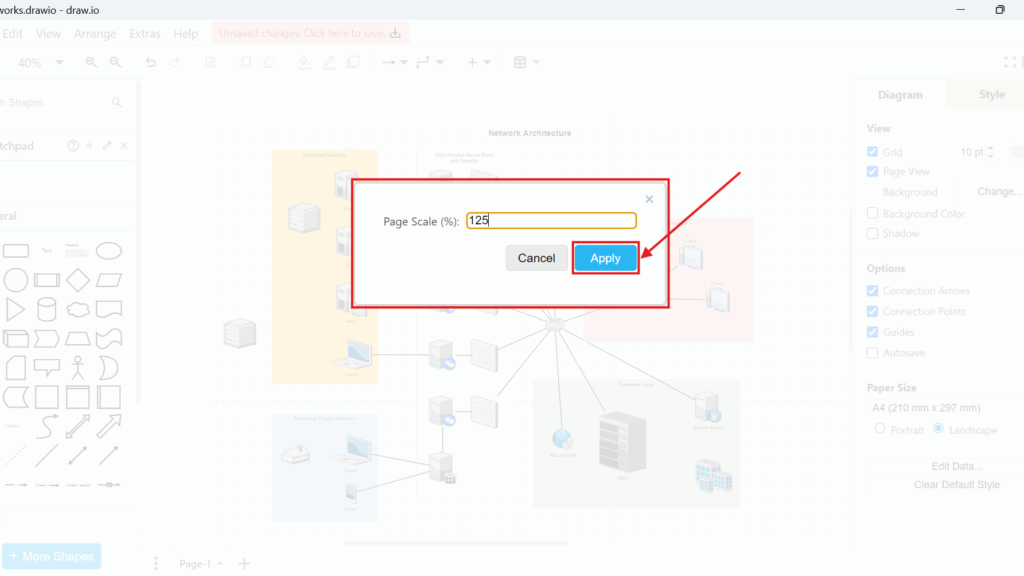
Precise scaling makes diagrams easier to read, print, and export. That is why I adjust the page scale when a layout needs better control. In this guide, I explain how to change the page scale in draw.io. You’ll learn why scaling matters and how it helps your diagram fit the page more clearly.
What Is the Page Scale in draw.io?
Page Scale controls the scale that draw.io uses for the page. As a result, changing it affects the size of my diagram when I print it or export it as a PDF.
Page Scale changes the output scale of my diagram rather than simply changing my view of the canvas.
This distinction matters. For example, zooming in does not change the printed size of my diagram. It only helps me see the diagram more clearly while editing it.
Likewise, Page Scale differs from Paper Size. Paper Size defines dimensions such as A4. Page Scale changes how the diagram relates to that page.
How to Change the Page Scale in draw.io
I can change the setting in a few steps:
- I open the diagram that I want to adjust.
- I make sure that Page View is enabled. If necessary, I enable it in the Diagram panel on the right.
- Then, I open the View menu.
- I select Page Scale.

The Page Scale dialog now opens.
- I enter the required percentage. For example, I can enter 125.
- Finally, I click Apply. I can also confirm the value with Enter.
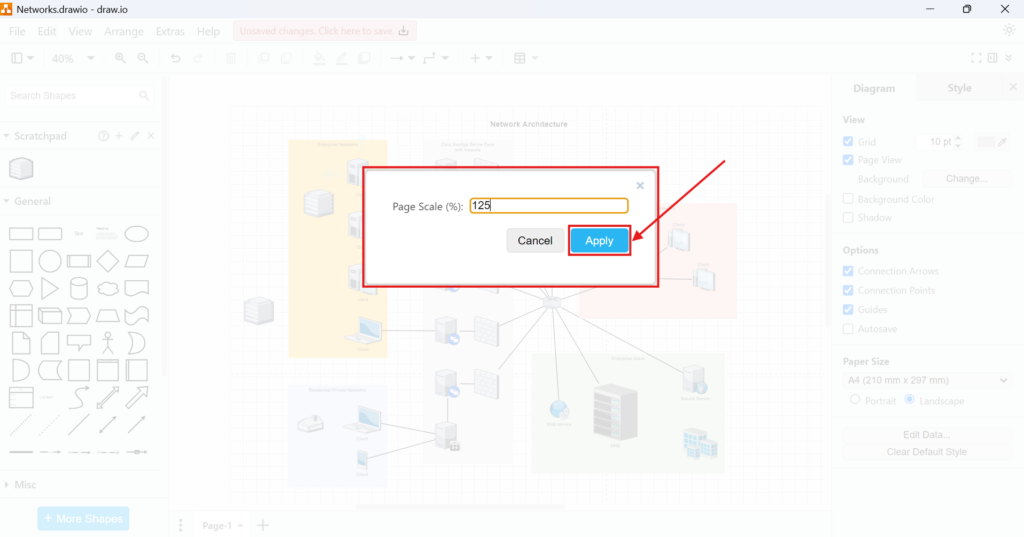
The new setting now applies to the page.
Page Scale vs. Zoom vs. Paper Size
These three settings solve different problems:
| Setting | What I use it for |
|---|---|
| Page Scale | Changing the diagram size for printing or PDF export |
| Zoom | Making the diagram appear larger or smaller while I edit |
| Paper Size | Choosing physical page dimensions such as A4 |
I use Page Scale when I need to control output size, not when I simply want a better view of the diagram.
This distinction prevents unnecessary changes to shapes, text sizes, or the overall layout.
When I Use Page Scale
I mainly use Page Scale when I prepare a diagram for printing or PDF export. For example, a large network diagram may extend across more pages than I want. Instead of manually resizing every shape, connector, and label, I can adjust the page scale and check the resulting layout.
However, I do not treat Page Scale as a replacement for good diagram structure. If a diagram contains too much information, changing its scale can make the content difficult to read. Therefore, I first make sure that the diagram itself remains understandable.
I use Page Scale to optimize an already well-structured diagram, not to force an overloaded diagram onto one page.
Choosing the Right Page Scale
There is no single percentage that works for every diagram. Therefore, I normally start from the existing value and make small adjustments.
For example, I may enter 125% and inspect the result. If the output still does not meet my needs, I adjust the value again.
Before I finish, I also check the PDF or print result. This is especially important when the exact page distribution matters.
Conclusion
Changing the page scale in draw.io is simple. I open View > Page Scale, enter the required percentage, and apply the change.
More importantly, I use the setting for the right purpose. Page Scale affects how my diagram is sized for printing and PDF export. Zoom only changes my working view, while Paper Size defines the physical page dimensions.
Once I understand these differences, I can prepare diagrams for print and PDF output without unnecessarily resizing individual elements.
What’s Next?
Now that I know how to change the page scale in draw.io, I can control my diagram layout even more precisely. Scale helps with size, but grid units help with alignment and measurement. In the next article, I’ll explain How to Change the Grid Units in draw.io. You’ll learn how grid units affect your workspace and how they help you place diagram elements more accurately. Click below to continue and adjust your grid units in draw.io.
Build a Clearer Workflow with Requirements Engineering Tools
Requirements engineering works best when I use tools that support clarity, structure, and collaboration. Therefore, I use draw.io to visualize ideas, Confluence to document knowledge, Jira to manage requirements-related work, and Camunda to model business processes. Each tool helps me handle a different part of the workflow. As a result, I can connect diagrams, decisions, tasks, and processes in a more practical way. In the main article on Requirements Engineering Tools, I show how these tools help me improve requirements work from the first idea to implementation.